How to read and write variables ?
This python script example shows how to read and write a design variable which is used in the circuit. In the GUI, these variables can be reached through the Design Variables panel.
To illustrate this script, the design named AC-DC 3-phase Thyristor Bridge from SIMBA collection of examples is used.
This example shows an AC-DC 3-phase controlled phase rectifier with:
- an AC grid voltage of 230 V and a frequency f_{grid} of 50 Hz,
- a DC current source which represents the load,
- a delay angle of 30°.
SIMBA circuit
Below the AC-DC 3-phase Thyristor Bridge circuit designed inside SIMBA Desktop.
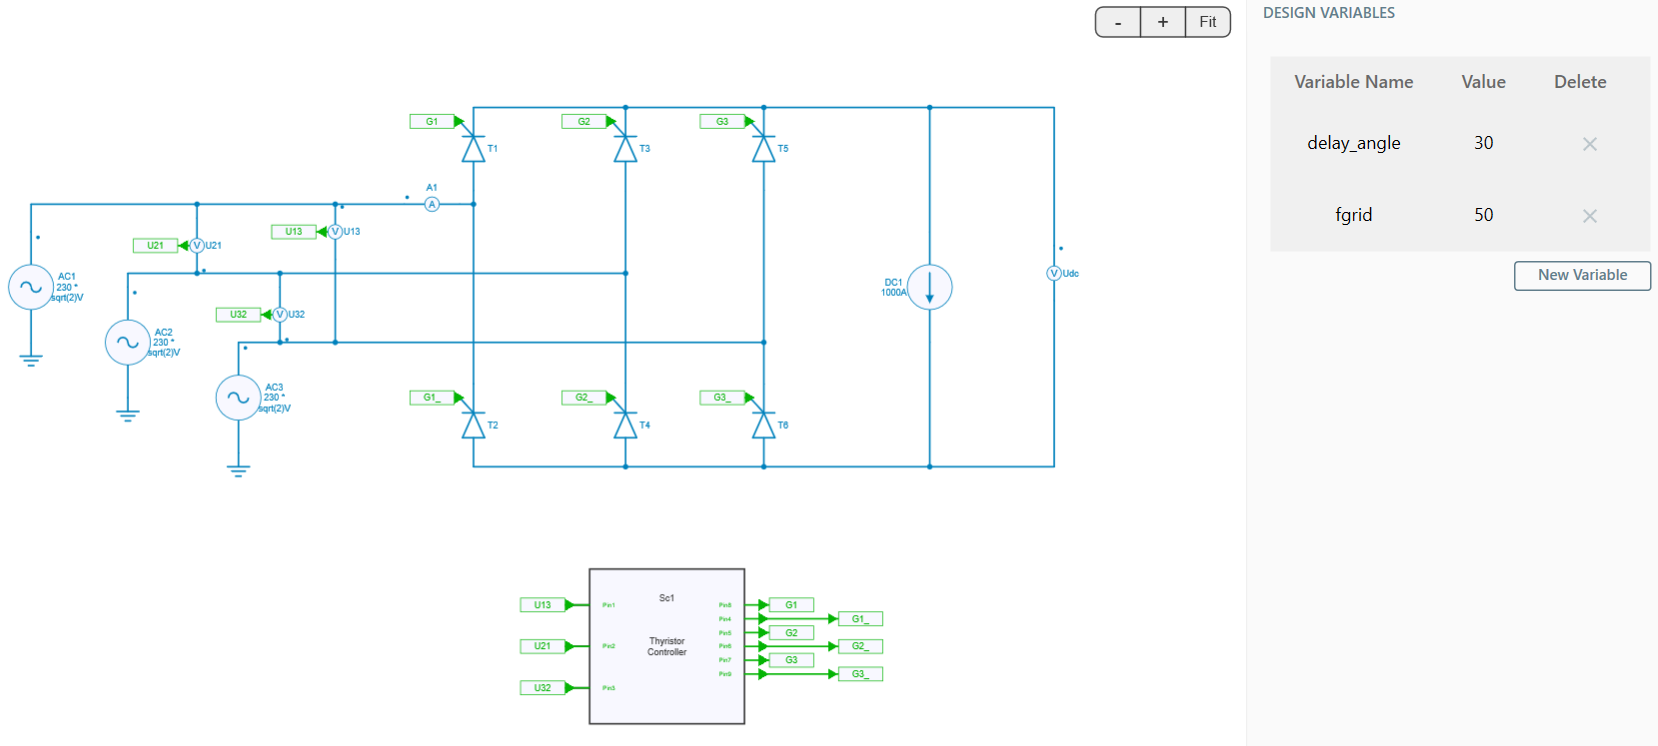
The schematic above shows the electrical top model considered of this controlled phase rectifier.
Thyristors are ideal components, the DC current source is 1000 A and the differential voltage meter allows to measure the output voltage called U_{dc}.
The DESIGN VARIABLES panel shows two variables which are used in this design:
- the delay angle (in degrees) - written delay_angle in the design - used in the subcircuit of the delay angle control,
- the AC grid frequency f_{grid} - written fgrid in the design - used in three-phase voltages sources and in the subcircuit of the delay angle control.
Python Script
The Python script used for reading and writing variables will do the following tasks:
- import all the necessary libraries
- load the circuit (ACDC_3ph_ThyristorBridge) from SIMBA collection of examples and read the default value of f_{grid} parameter,
- run a transient analysis of the original circuit with default f_{grid} (here 50 Hz) and retrieve the output voltage U_{dc},
- assign a new value for parameter f_{grid} = 60 Hz, run a new transient analysis with f_{grid} modified and retrieve the new output voltage U_{dc} for f_{grid} = 60 Hz,
- plot the output voltage U_{dc} for both values of f_{grid}: 50 and 60 Hz.
Conclusion
Below the result of the output voltage once the simulation is over through the Python script:
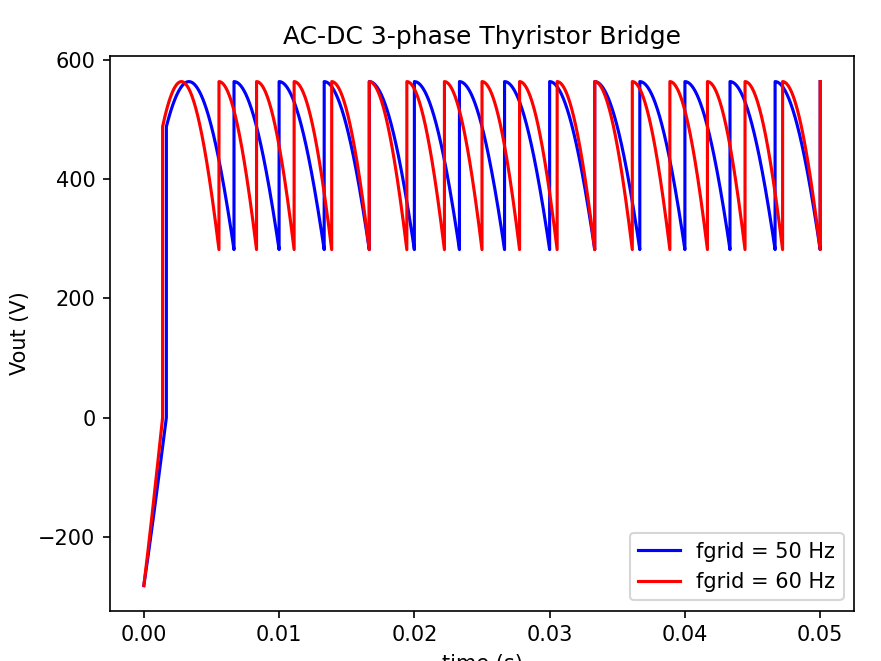
The blue curve corresponds to the output voltage U_{dc} with f_{grid} = 50 Hz rather than the blue one which corresponds to f_{grid} = 60 Hz.
We can clearly observe the impact of the grid frequency on the output voltage.
It is important to say that any variables defined into the design variables window could be tuned for understanding the impact of such modification in the circuit.