Three-Phase PFC Rectifier including Phase-Locked Loop
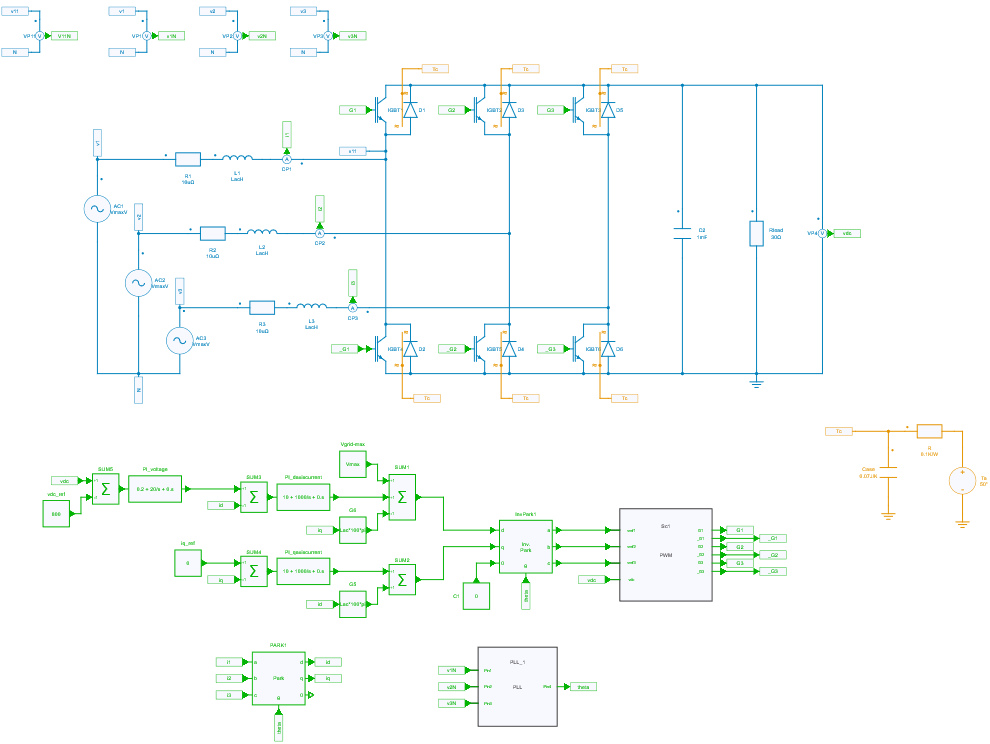
This example shows a three-phase grid-tied inverter operating as a rectifier which draws sinusoidal currents from the AC grid:
- an AC voltage of 400 V,
- a DC voltage of 800 V,
- a power of 16 kW.
Note
Two different implementations are proposed, depending on the current probe convention: inverter or rectifier. The inverter implementation proposes a thermal model of the powerswitches.
Control
Two goals are targeted:
- draw sinusoidal currents from the AC grid,
- regulate the DC voltage.
Current control is achieved using a DQ control with:
- a measure of the phase currents,
- a DQ transformation where the angle is extracted from a Phase-Locked Loop,
- a PI controller which controls the phase-neutral voltages of the rectifier,
so that the phase currents track their reference values which come from the outer control loop that regulate the DC voltage.
PWM modulation
A classic sinus modulation is used here and the transfer function from the duty cycle to converter output is considered as proportion unit.
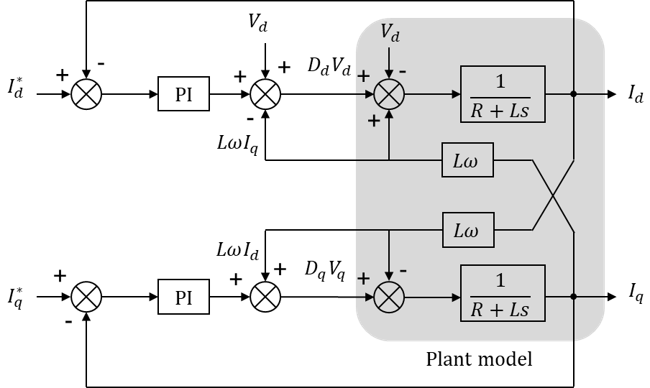
Inner current control loop
According to the Kirchoff voltage law in the AC side, the current is driven by the following equation for example for phase a [1]:
where V_{a1} is the inverter AC voltage such as: V_{a1} = \left( D_a - \dfrac{D_a + D_b + D_c}{3} \right) U_{dc} where D_a, D_b and D_c are the duty cycles. All variables denote state-average values.
According the abc-dq transformation, these phase equations give in the dq domain:
With this state-average model of the grid-tied converter, to decouple the d and q axis the L\omega terms are feedforward. Using a PI to control the current of each axis the block diagram of the current loop control can be drawn as follows:
Phase-Locked Loop
The Phase-Locked Loop (PLL) considered here is a Synchronous Reference Frame PLL (SRF-PLL) and is shown in the figure below:
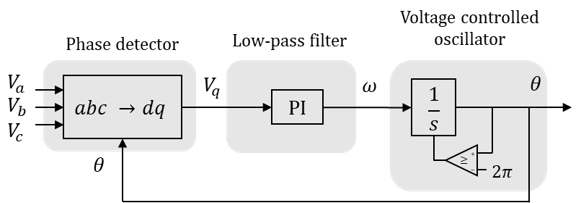
First, it is composed of a phase detector realised here with a abc -> dq transformation. Then, it has a low-pass filter, realised here with PI filter which also regulates te q voltage component to 0, so that the grid voltage is aligned with the d axis. At last, a Voltage Controlled Oscillator (VCO) integrates the angular speed from the PI output to get the phase angle \theta.
Outer voltage control loop
Assuming a loss-less converter, input and output power are balanced according the equation:
Where I_{dc} is a DC current considered from DC to AC side.
With the PLL, the d axis of the dq reference frame is aligned with the grid voltage so that the q axis component of the grid voltage becomes 0. The DC-link voltage can be controlled for the inner d-axis current control loop.
A PI regulator is used to control this DC voltage. It is worth mentionning that as an inverter convention has been chosen here, a minus sign appears in the equation. The inputs of the DC voltage loop have been inverted to take it into account.
Thermal model
This design also includes the thermal descriptions of the powerswitches and a thermal model of an heatsink with a RC network to simulate powerswitch losses and junction temperatures.
More information about "Thermal Losses" calculation can be found in the Thermal analysis section of Simba documentation.
Note
Check Thermal Data and Average loss calculation frequency fields in the powerswitch property panel. These define:
- the thermal data used during the simulation to compute powerswitch losses, i.e. the heatflow sent to the thermal model (here thermal data have been directly imported from infineon IKY50N120CH3 IGBT and diode),
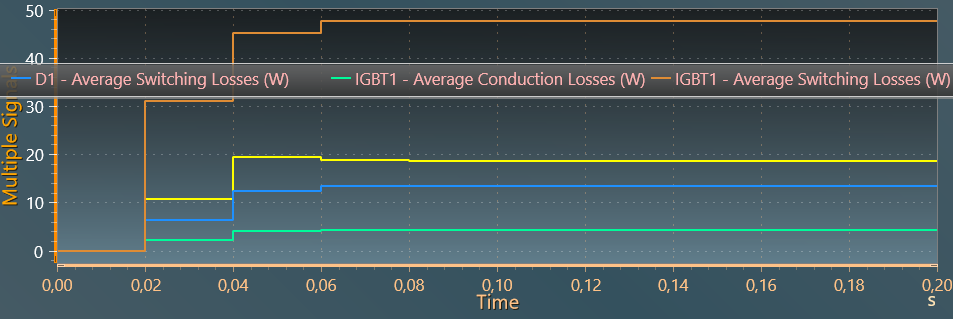
- the frequency value to compute the average values of switching, conduction and total losses which can be plotted in scopes.
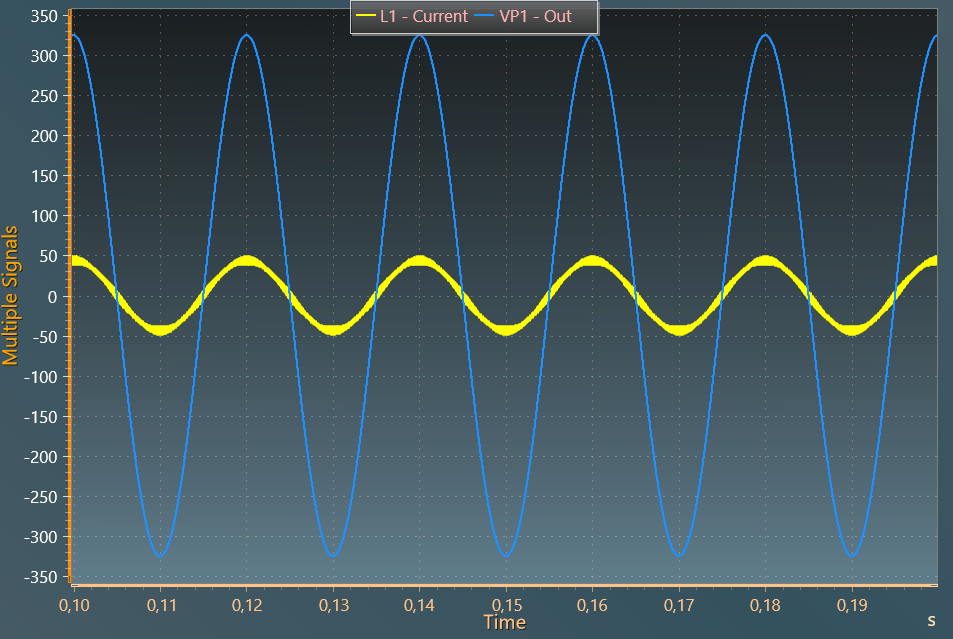
Simulation
The results below show the AC voltage and currents.
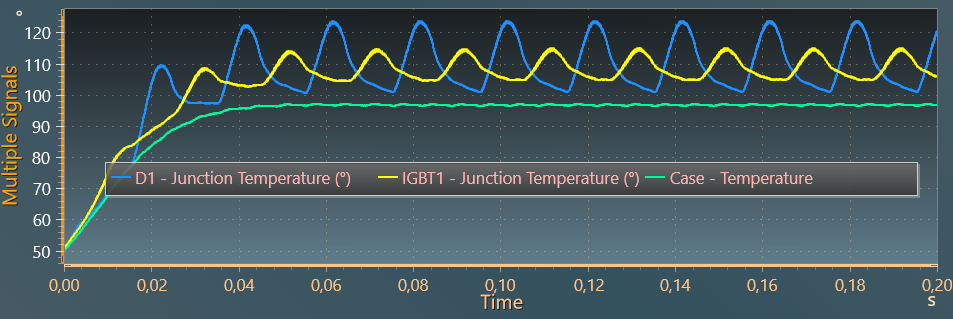
The first graph below show the average switching and conduction losses of igbt1 and diode 1 and the second one shows junction temperatures of igbt 1 and diode 1 and the case temperature (across the thermal capacitor of the heatsink).
Note
The powerswitch thermal impedance provided by the manufacturer here is a Foster network. Thus, to assume the connection of this model with the heatsink model, its is important to check the case temperature has much slower variations than the junction temperature (in other words the external thermal capacitance of the heastink should be much bigger than the capacitances within the Foster network).
[1] F. Blaabjerg, Control of power electronic converters and systems Vol.1, Academic Press, 2018.