Data visualization: Use of Bokeh for interactive plots of waveforms and XY graphs
Bokeh is an interactive visualization library for modern web browsers. It provides elegant, concise construction of versatile graphics and affords high-performance interactivity across large or streaming datasets.
Bokeh can help anyone who wants to create interactive plots, dashboards, and data applications quickly and easily.
More information about Bokeh could be found here.
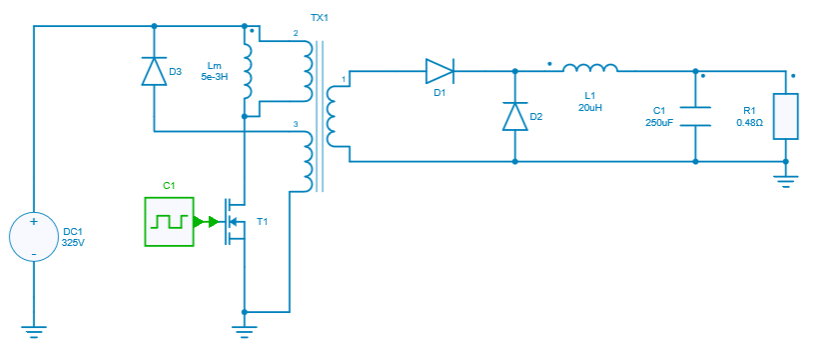
SIMBA circuit
Below the Forward converter circuit used for illustrating this Bokeh Python script. This example comes from the existing SIMBA collection of design examples.
Python Script
The Python script used for showing Bokeh capabilities will do the following tasks:
- Import Bokeh library
- Run a transient analysis of the Forward Converter and get the voltage across the mosfet T_{1},
- Plot the output voltage with Bokeh and observe the time and V_{ds} values when the signal is highlighted.
The following syntax output_notebook() is for Jupyter Notebook. In deed, if this line is disabled, a new HTML page will be opened showing the result once the script is run. If this line is enable, the script needs to be run with interactive cell option.
Conclusion
Below the simulation result once the script has been executed.
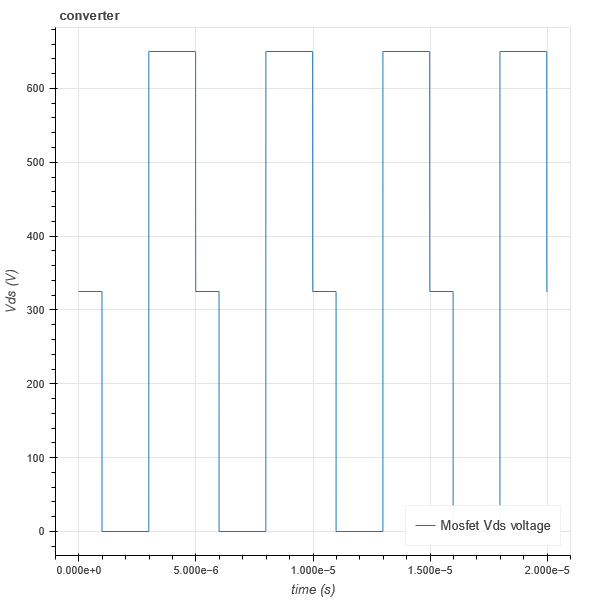
We can clearly observe time and voltage values on the figure.
It is also important to say that a valid internet connection is required when using bokeh library.