Using the "C code (external file)" block for debugging purpose
This tutorial explores the possibility to "Debug the C-code of your C-script block" in Simba
This feature can help you to:
- debug the C code
- compile the code in Debug mode
- check and edit the C code line by line
- modify some parameters and observe the modification done on the simulation
- place breakpoints at the desired location in order to stop the program
How to debug the C-code by using the "C code (external file)" block
To describe this feature, the example "C_debug" allowing to control the PWM signals of one DC-DC SR Buck Converter is considered. The "C code (external file)" block loads a file named "controller.c" which includes all the necessary C code for the control stage by calculating the duty_cycle value.
✔ Step 1: Firstly, you'll need to install :
✔ Step 1.a: Visual studio software
✔ Step 1.b: C/C++ extension for VS Code
✔ Step 1.c: Mingw -w64 via MSYS2 package, which provides up-to-date native builds of GCC, Mingw-w64, and other helpful C++ tools and libraries.
More information could be found at:
- C Code section of SIMBA documentation,
- Visual Studio Code website
✔ Step 2: Secondly, you need to make sure that the same circuit works without any issue if you run the C code directly by using the "C code" block rather than "C code (external file)".
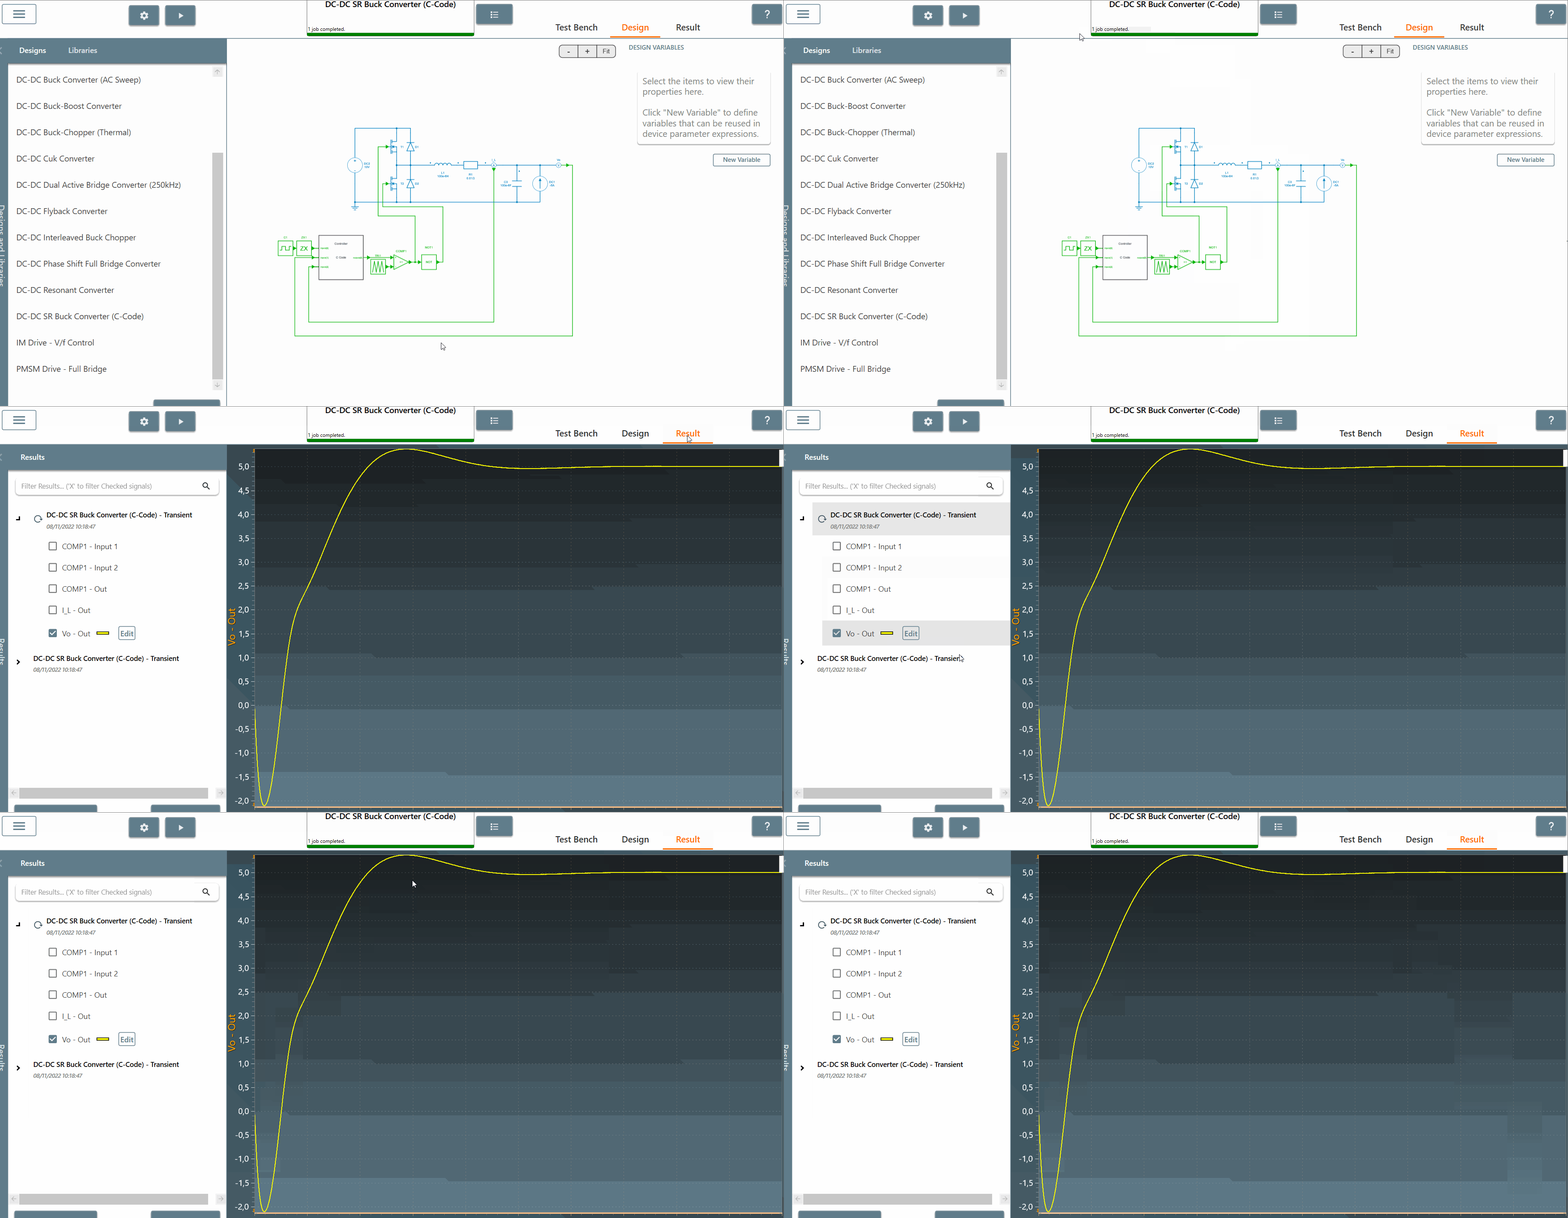
✔ Step 2.a: In that case, let's run the circuit "DC-DC SR Buck converter (C code)" without changing any parameters settings of the solver.

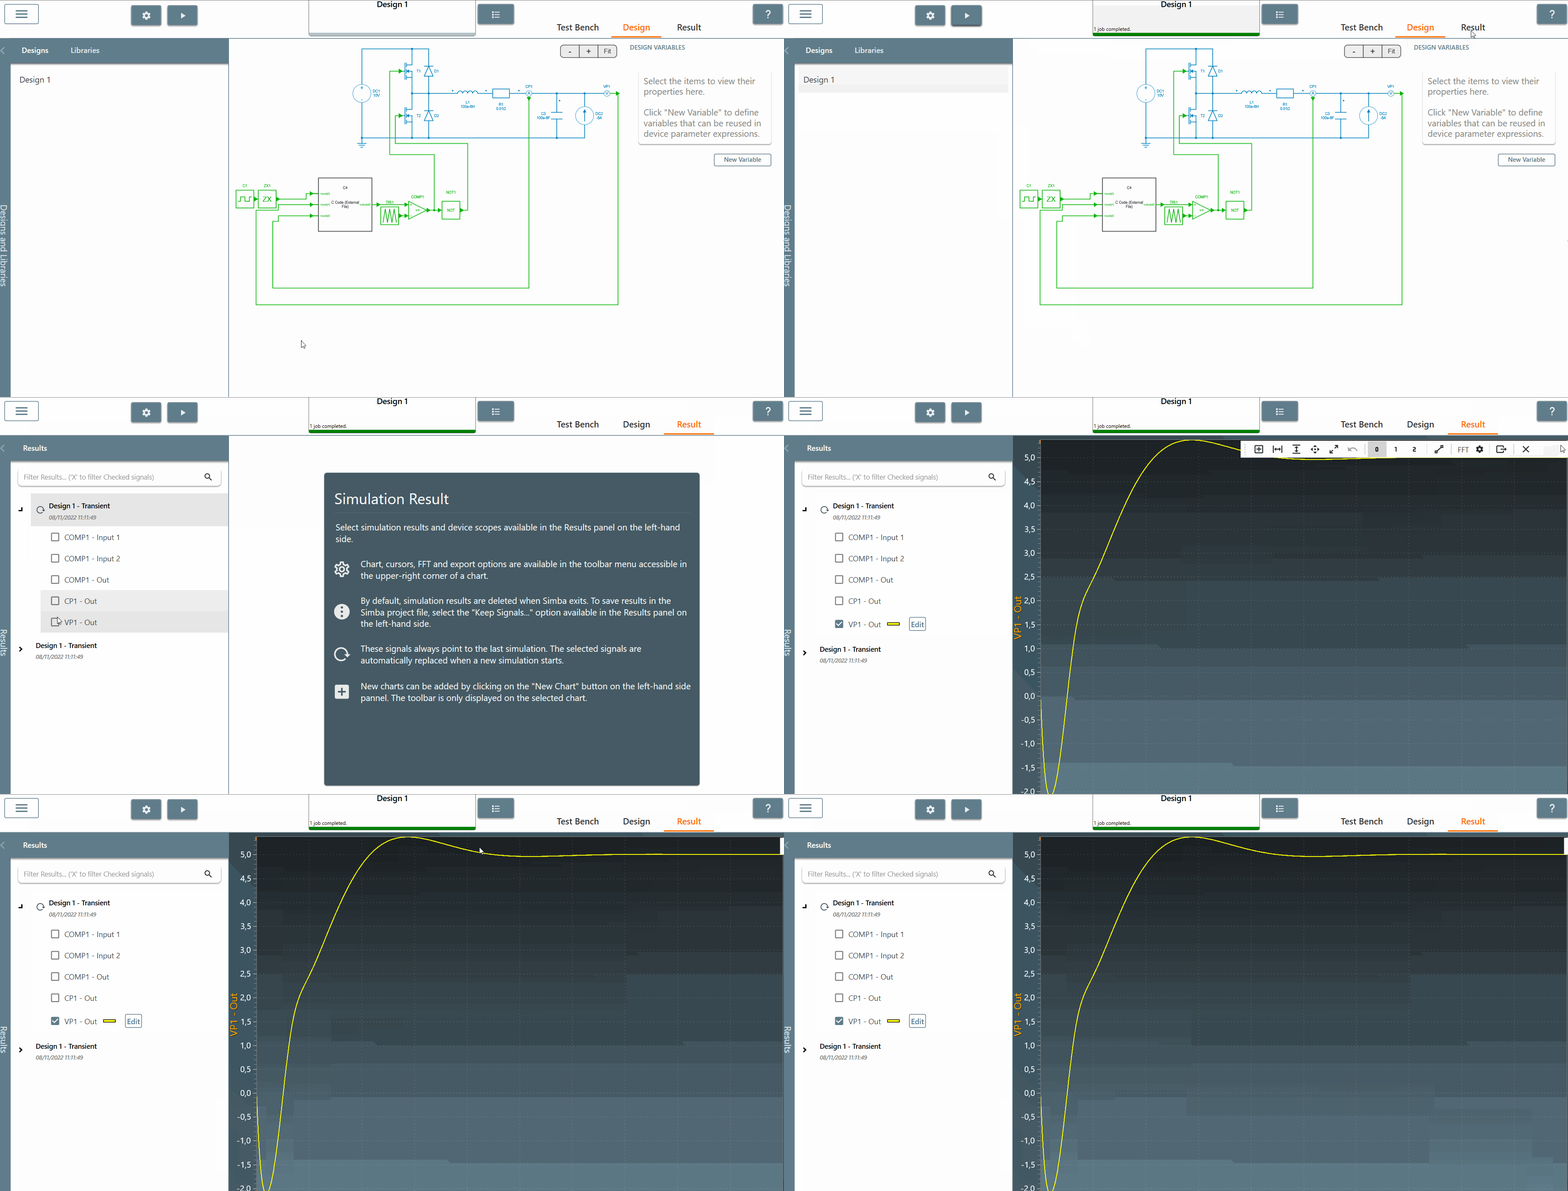
✔ Step 2.b: We can observe the output voltage "Vo" which is equal to 5 V in steady state.
✔ Step 3: Thirdly, the next step is to edit the "C code" block and copy/paste all the C code into a .c file named "controller.c".
✔ Step 3.a: Let's create a new file name "controller.c" inside a folder name "debug_C_code".
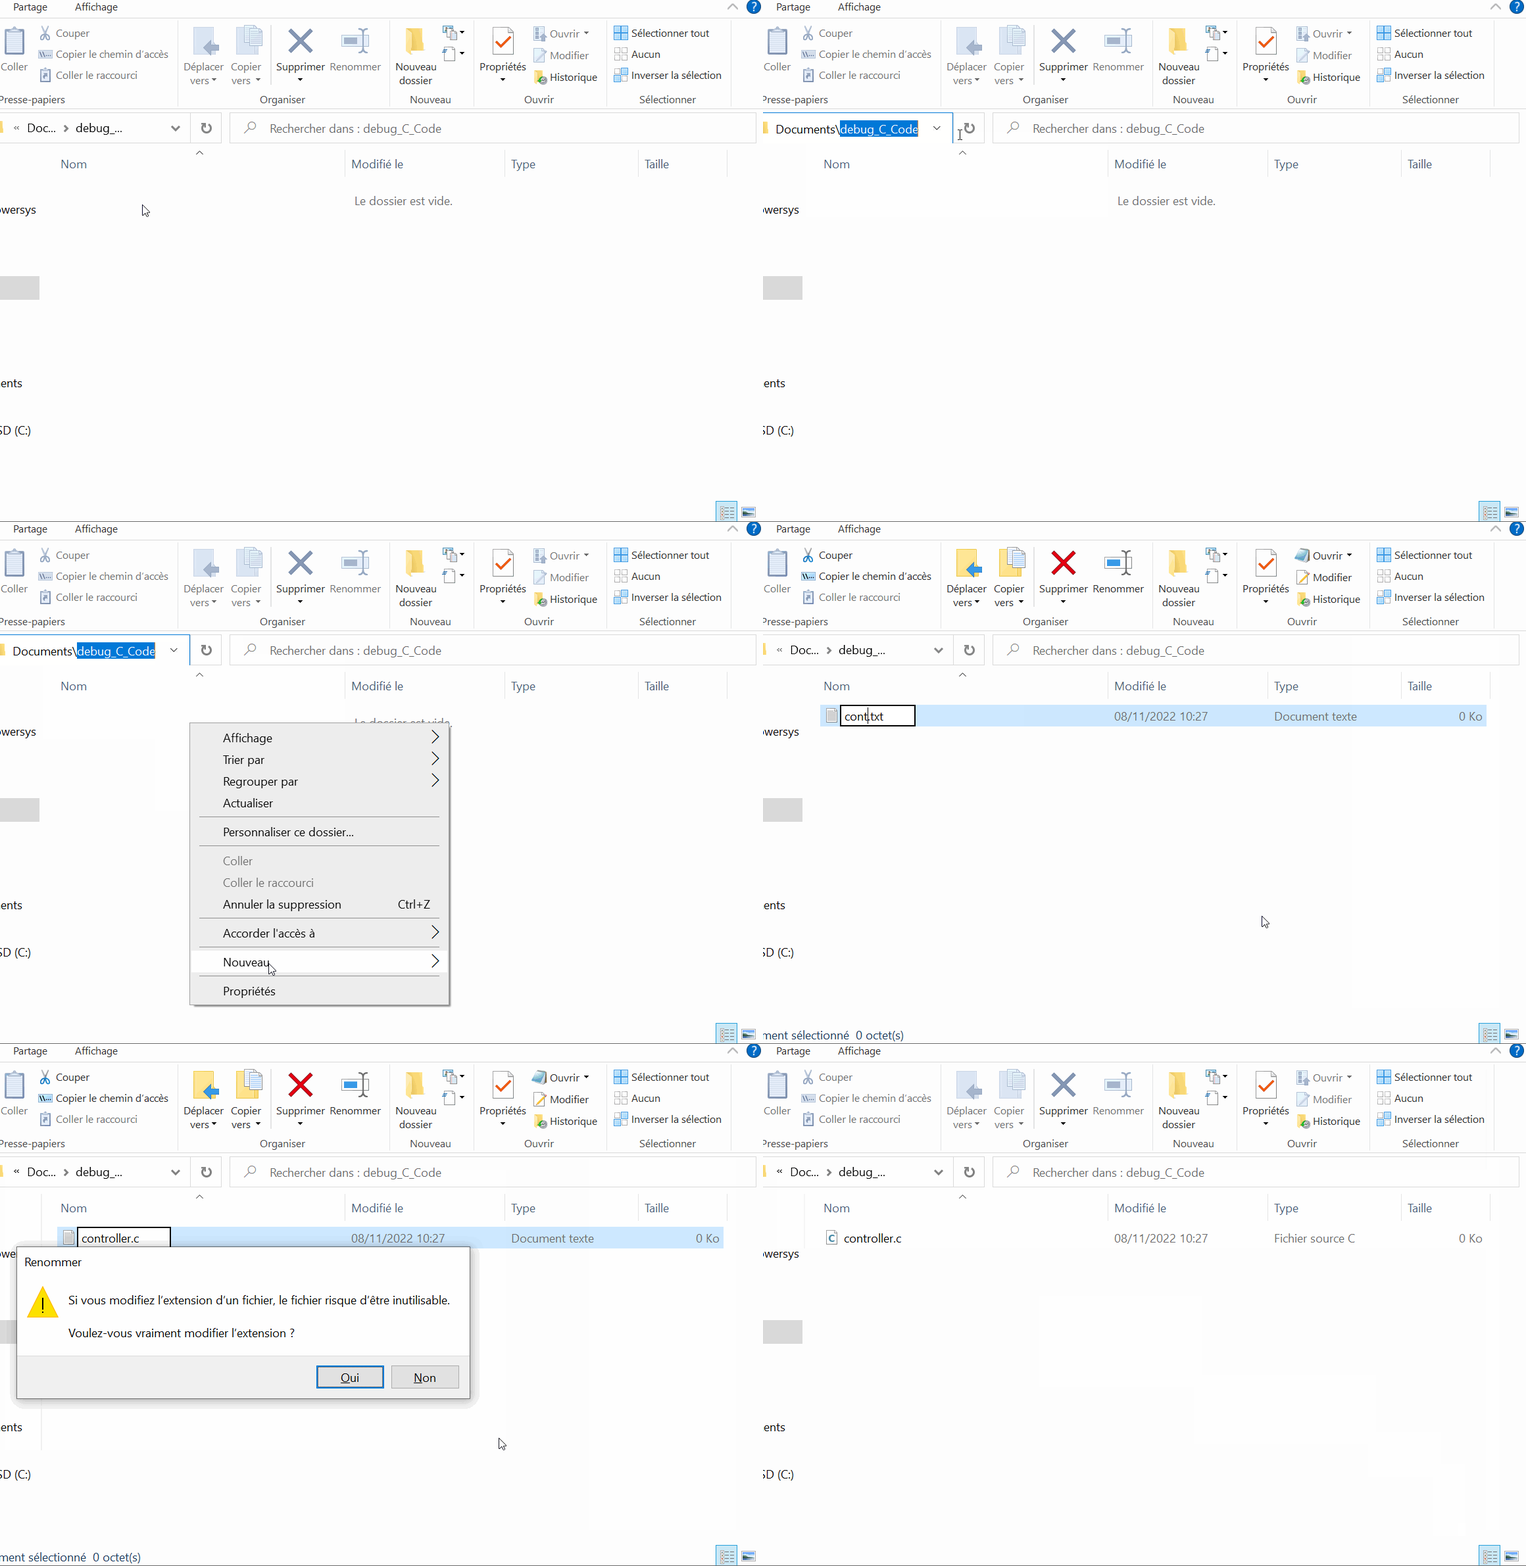
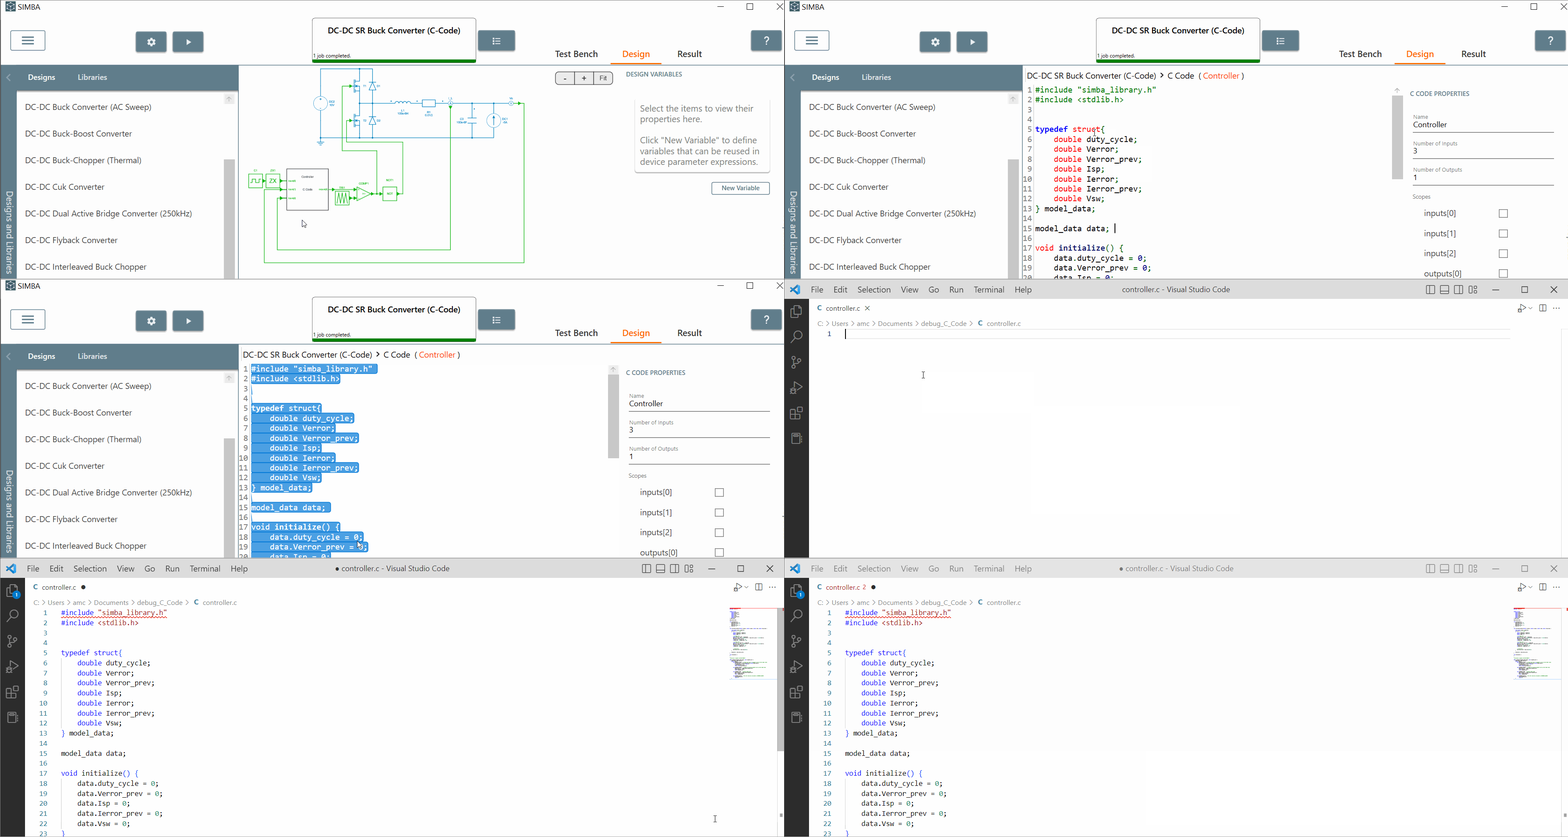
✔ Step 3.b: Edit the C code from the SIMBA circuit and select all the content, then copy it and paste the code into the "controller.c" file opened into Visual Studio.
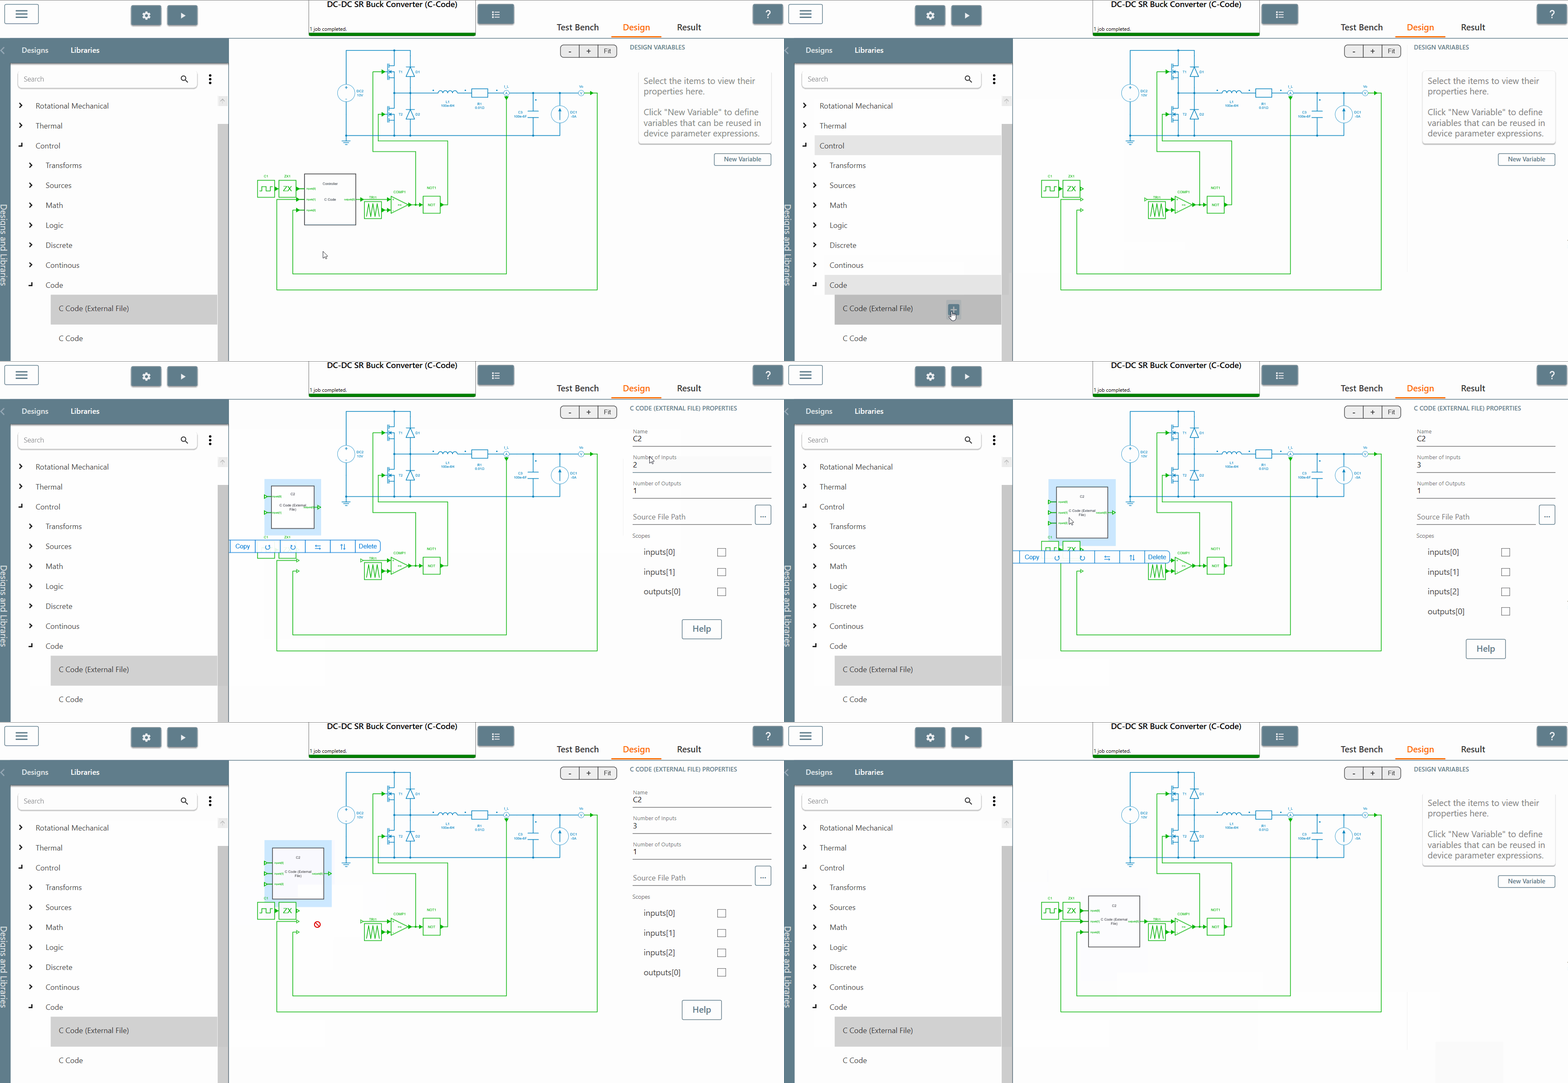
✔ Step 3.c: Remove the "C code" block, replace it by the "C code (external file)", adjust the number of inputs/outputs and connect this block to the circuit.
✔ Step 3.d: Set the source path of the "controller.c" file.
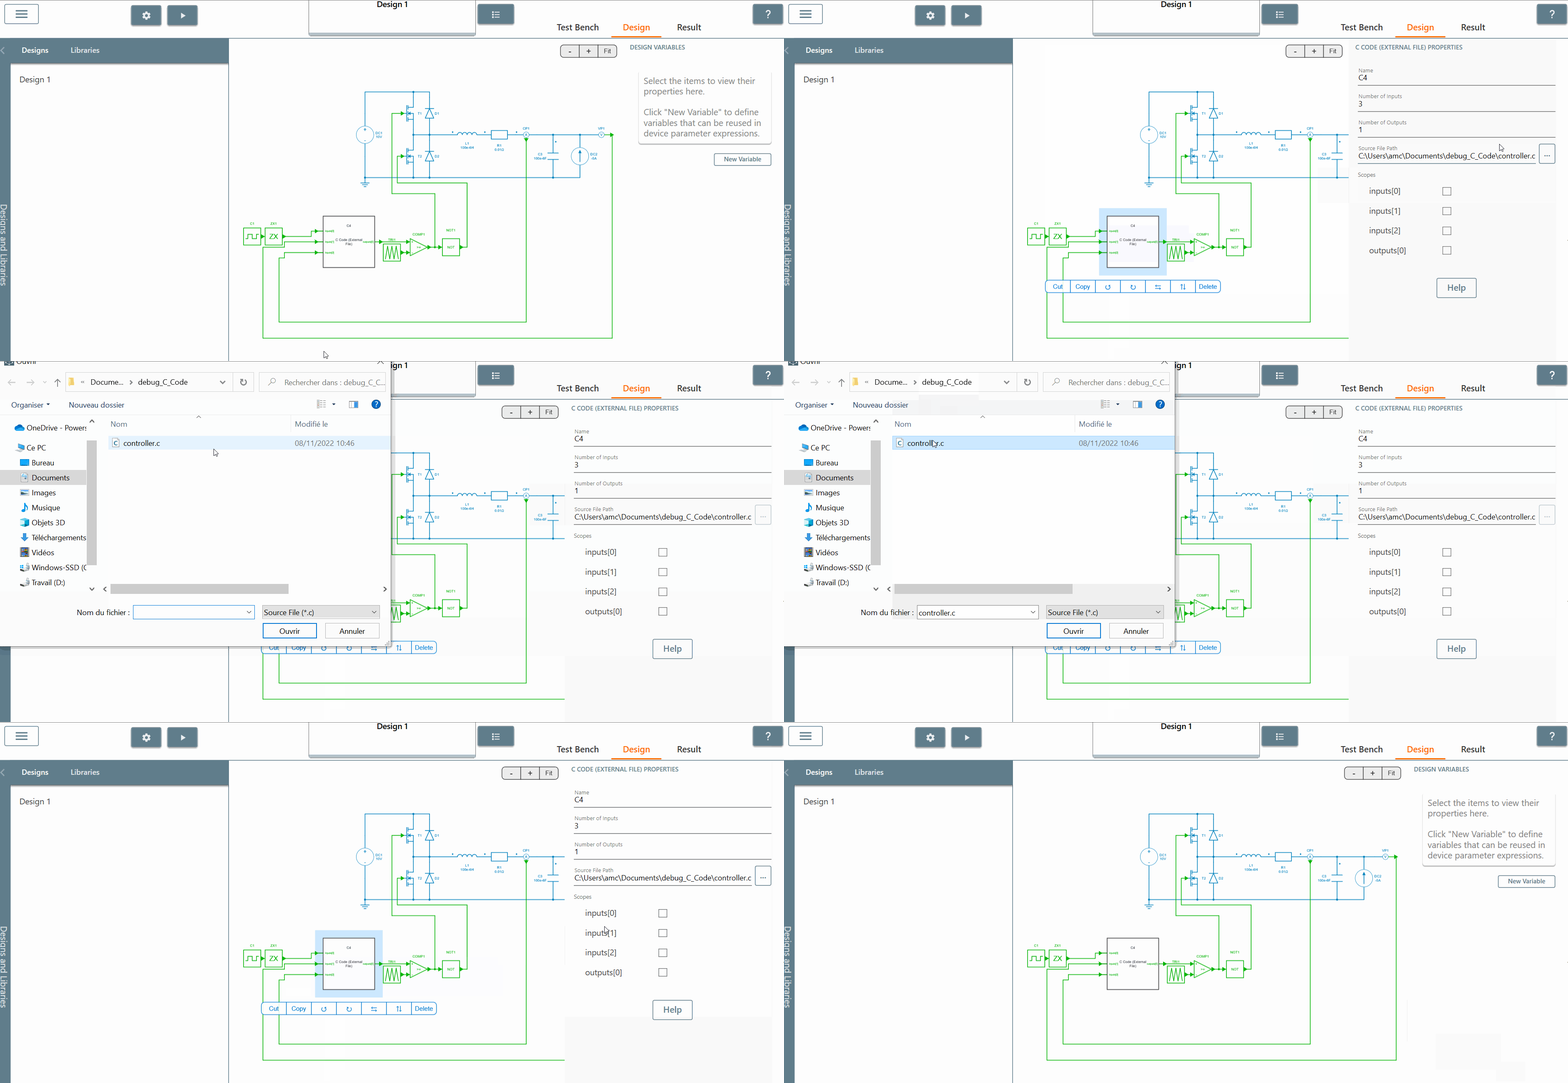
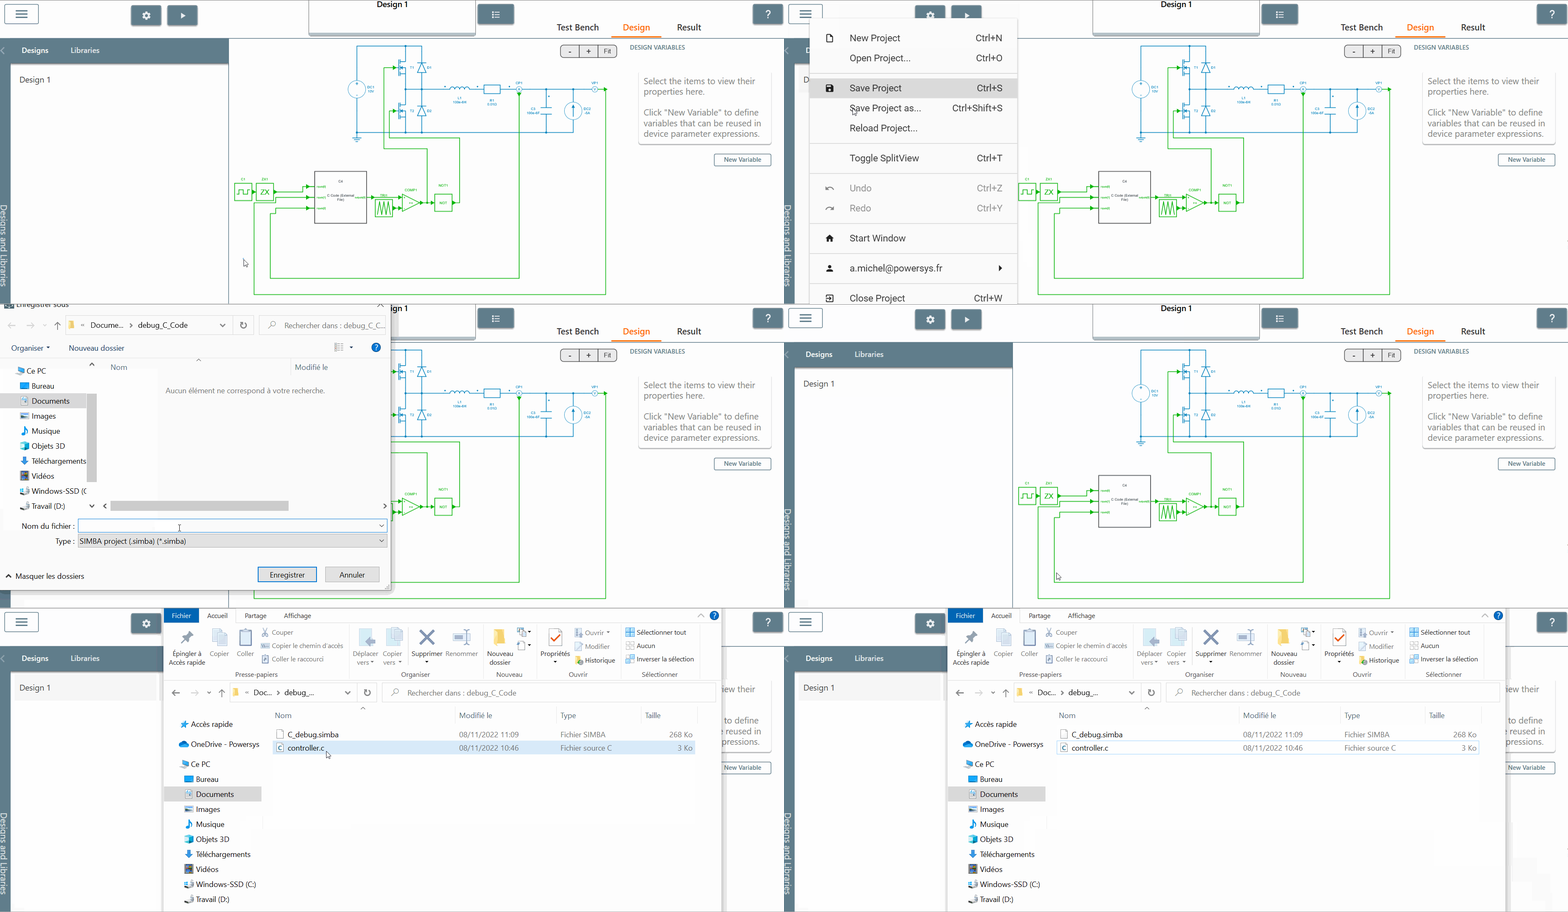
✔ Step 3.e: Let's save the circuit such as "C_debug.simba" inside the same folder "debug_C_code".
✔ Step 3.f: Run the circuit and observe the results which are identical as before. The output voltage is still equal to 5 V in steady state.
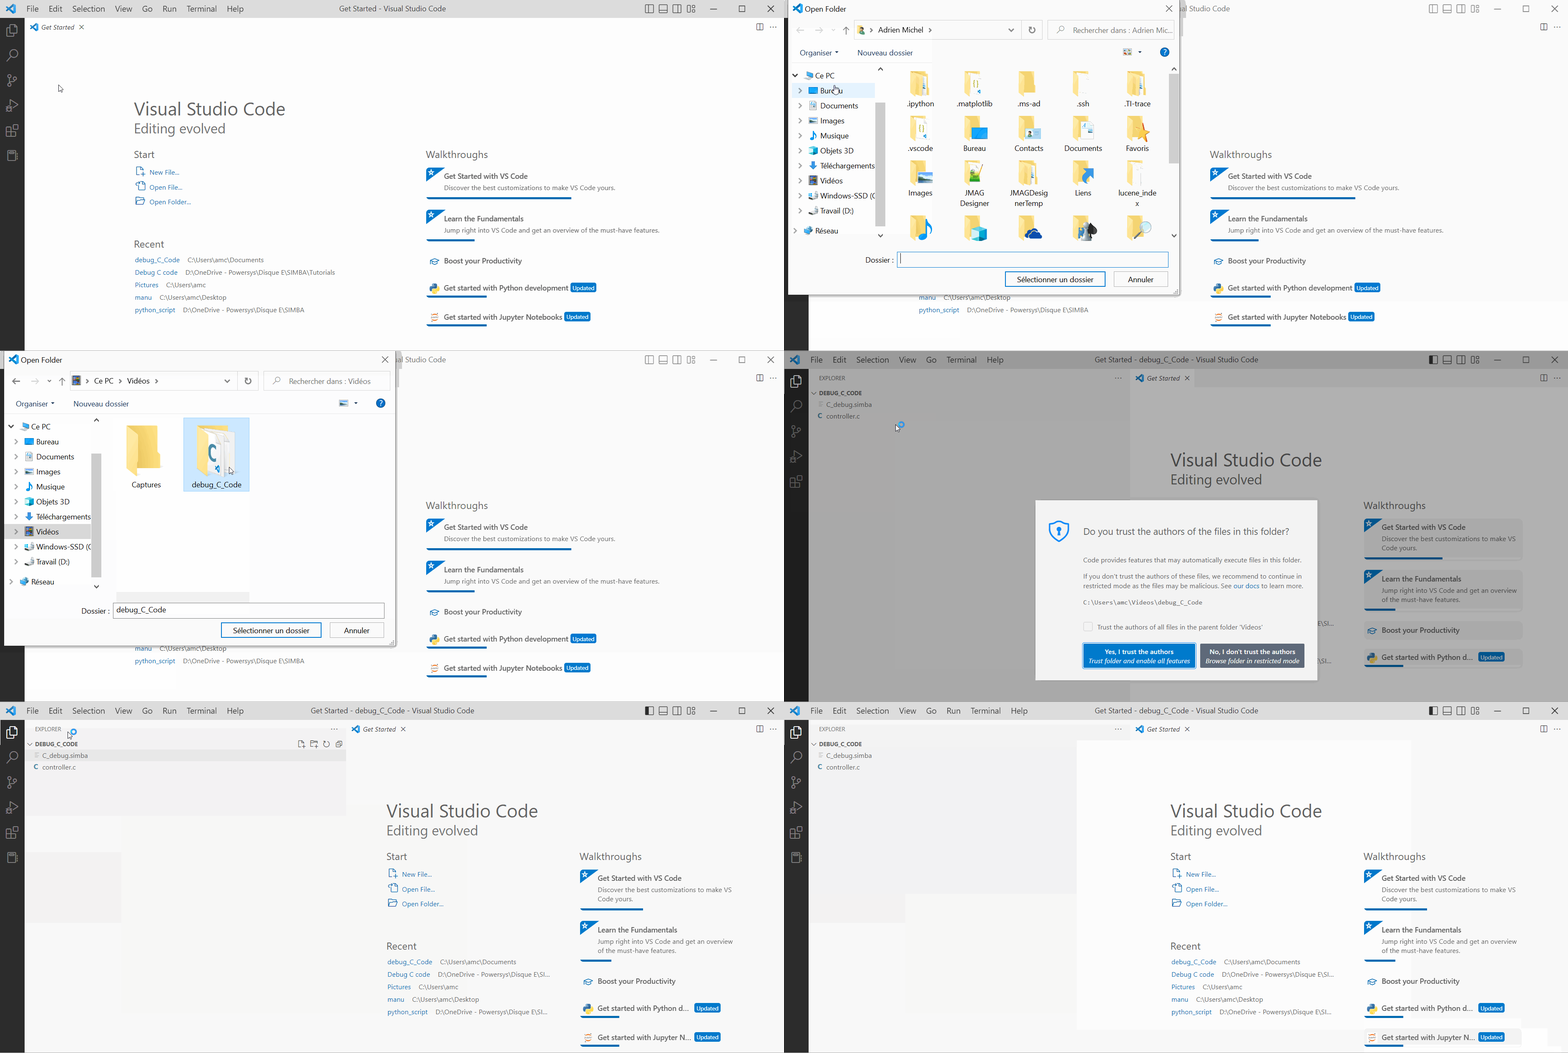
✔ Step 4: Finally, open Visual studio and follow the below steps:
✔ Step 4.a: Open the folder "debug_C_code" and you'll observe into the "explorer" section all the files contained into this folder. This confirms that you are working into this current folder.
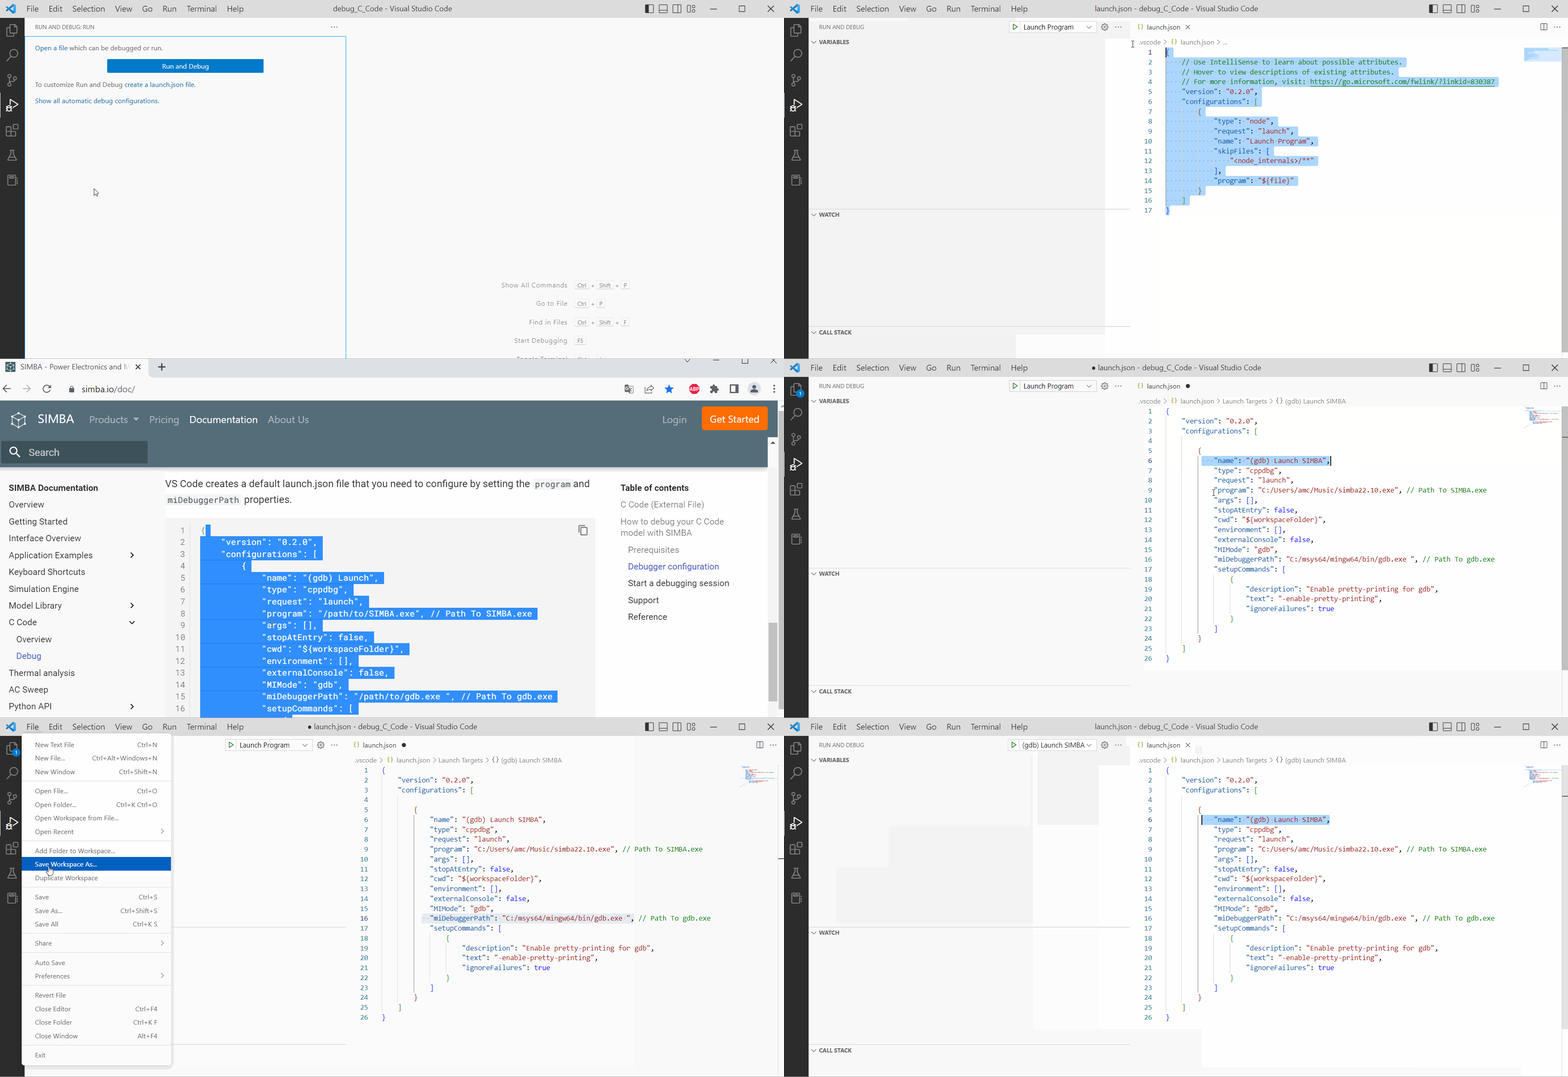
✔ Step 4.b: Let's create now a "launch.json" file which will launch the GDB debugger and SIMBA if you press F5 to debug the program. * Click into the "Run and Debug" section and click on "create a new launch.json" file.
- Choose "C++" as you have installed previoulsy C/C++ extension for Visual Studio. If "C++" is not found, choose the first item "node.js" and the "launch.json" file will be created automatically. Delete the contents shown and use the one that you can find on simba website --> "Documentation" section --> C code --> Debug section.
You'll need to modify the path for both "program" and "miDebuggerPath" lines accordingly to your computer. You can also change the line "name": "(gdb) Launch SIMBA" and save the file.
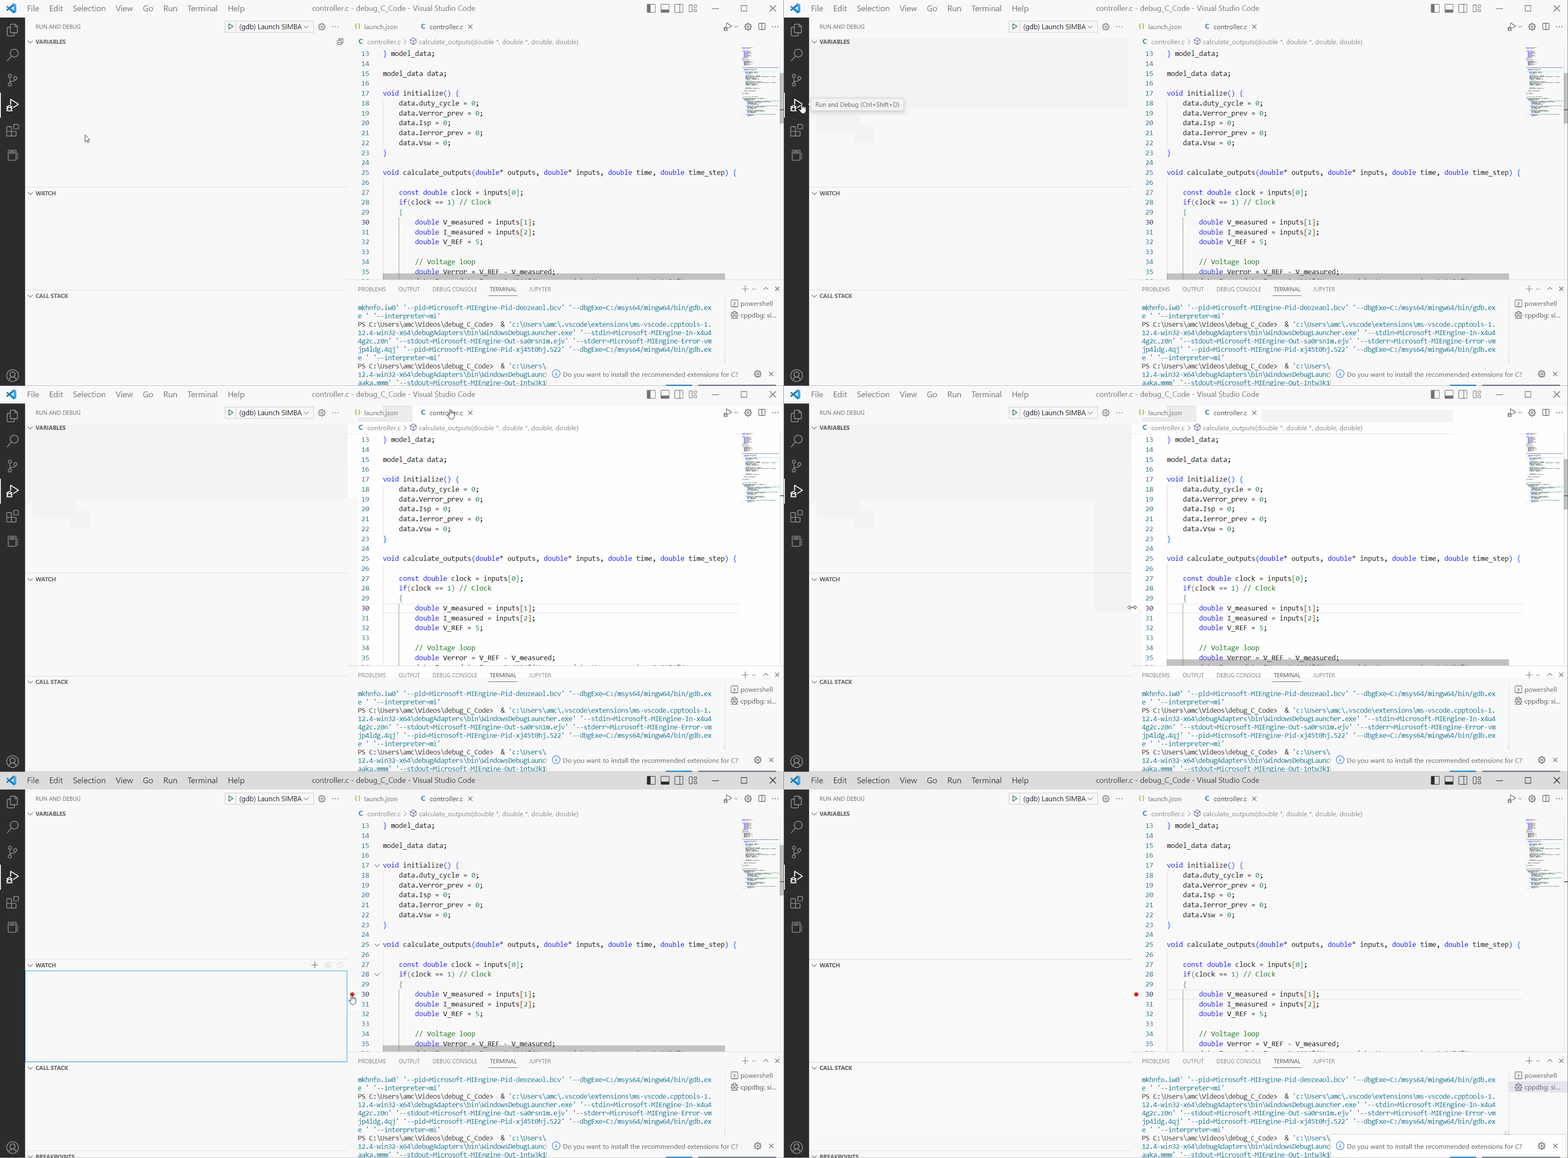
✔ Step 4.c: Now you can place any breakpoints inside the "controller.c" file. Let's place one breakpoint at line 30. So the process will start to run and debug the code and will stop at this line 30 every loop.
✔ Step 4.d: Then you'll see appear a button "(gdb) Launch SIMBA". Let's click on this button and after few seconds a new instance of SIMBA will be opened automatically.
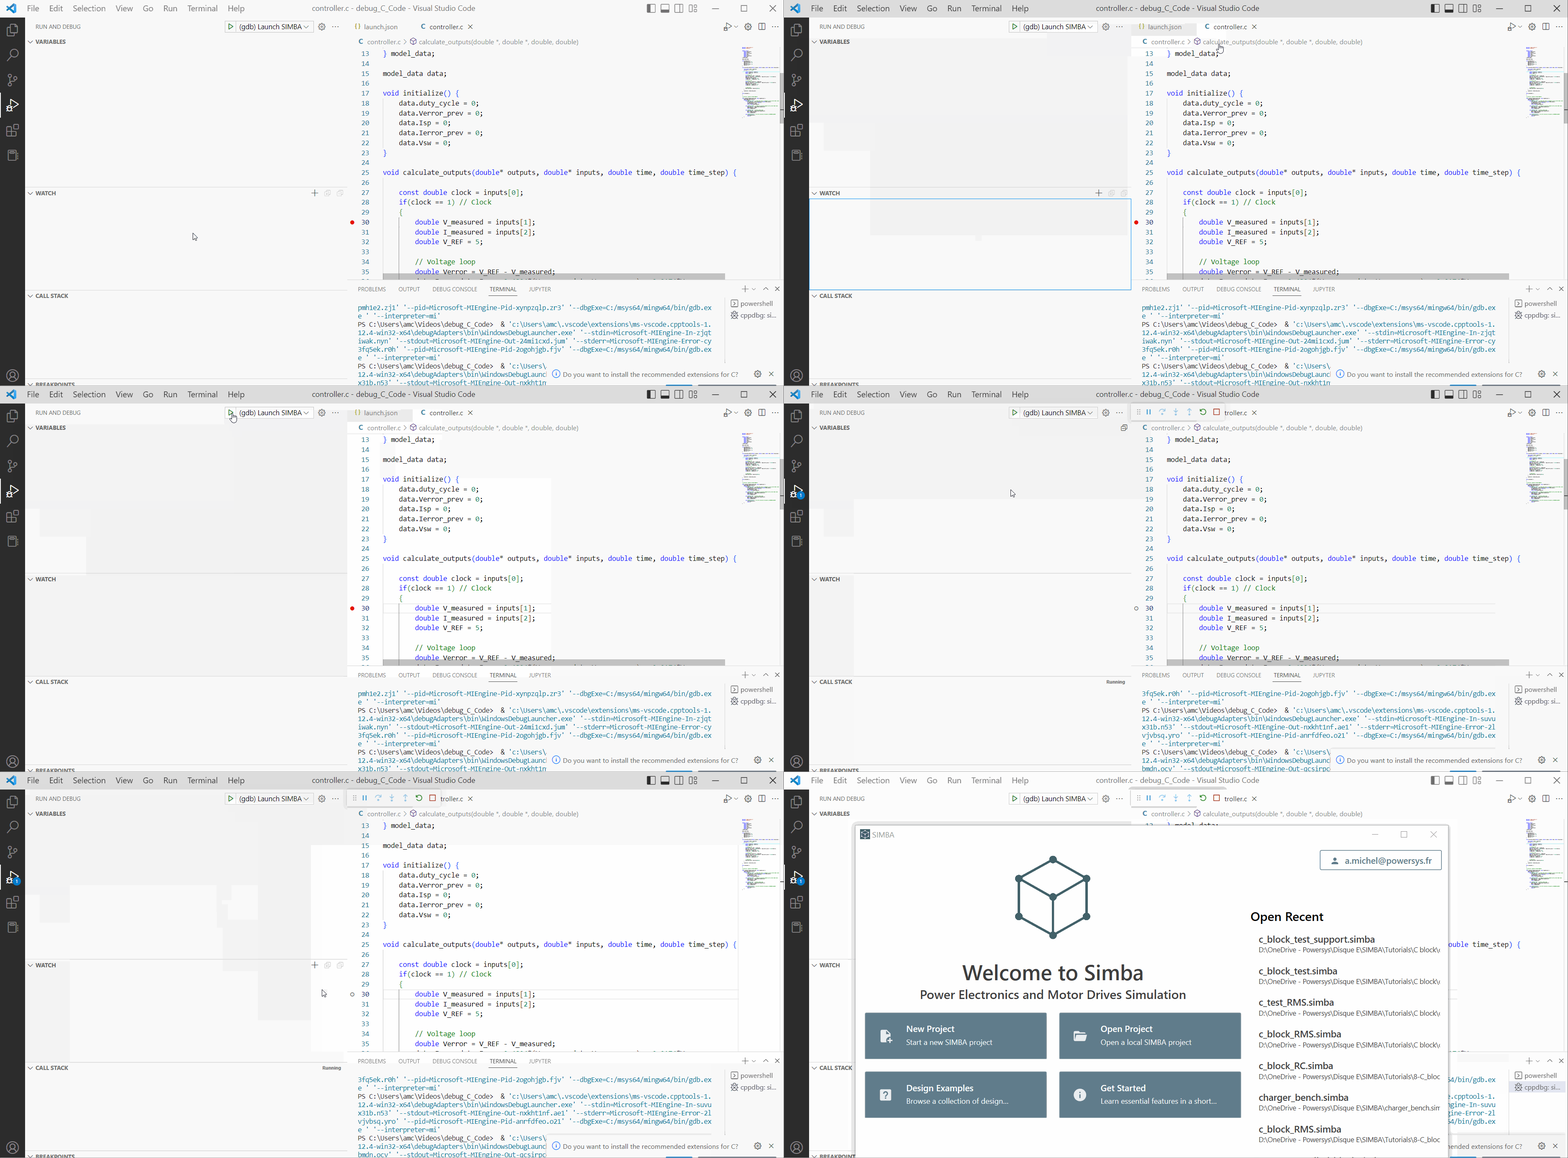
✔ Step 4.e: Let's open the " C_debug.simba" file and just after running it you'll observe that SIMBA is now slower because you are in debug session. As a result SIMBA is in a "frozen" mode and Visual studio is ready to debug and will be opebed automatically. You cannot go back inside the SIMBA circuit until you stop the debug session.
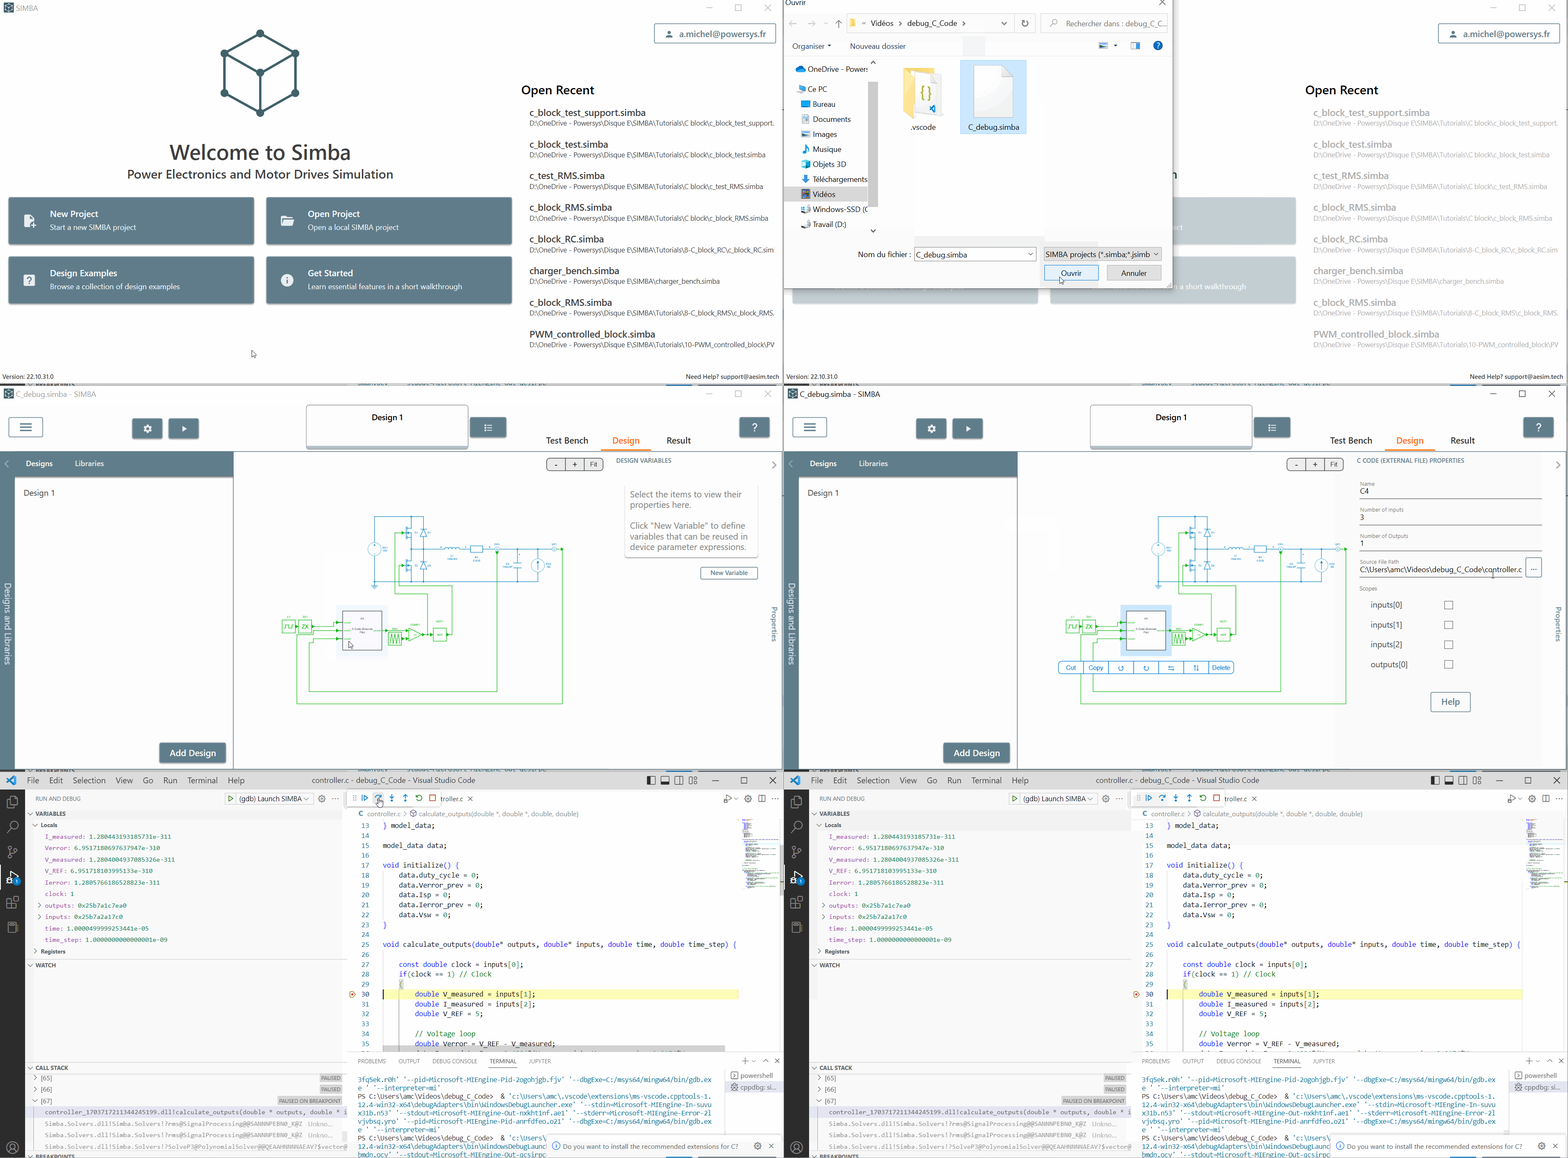
✔ Step 4.f: Now you are in "debug session":
- You can observe the breakpoint set at line 30 and all the variables on the left side are calculated and updated during the debug session.
- You can still set any other breakpoints or you can also click on "continue button" or "step over" and you'll see all the variables modified accordingly to the simulation time.
- You can modify any parameters defined and check or edit the code
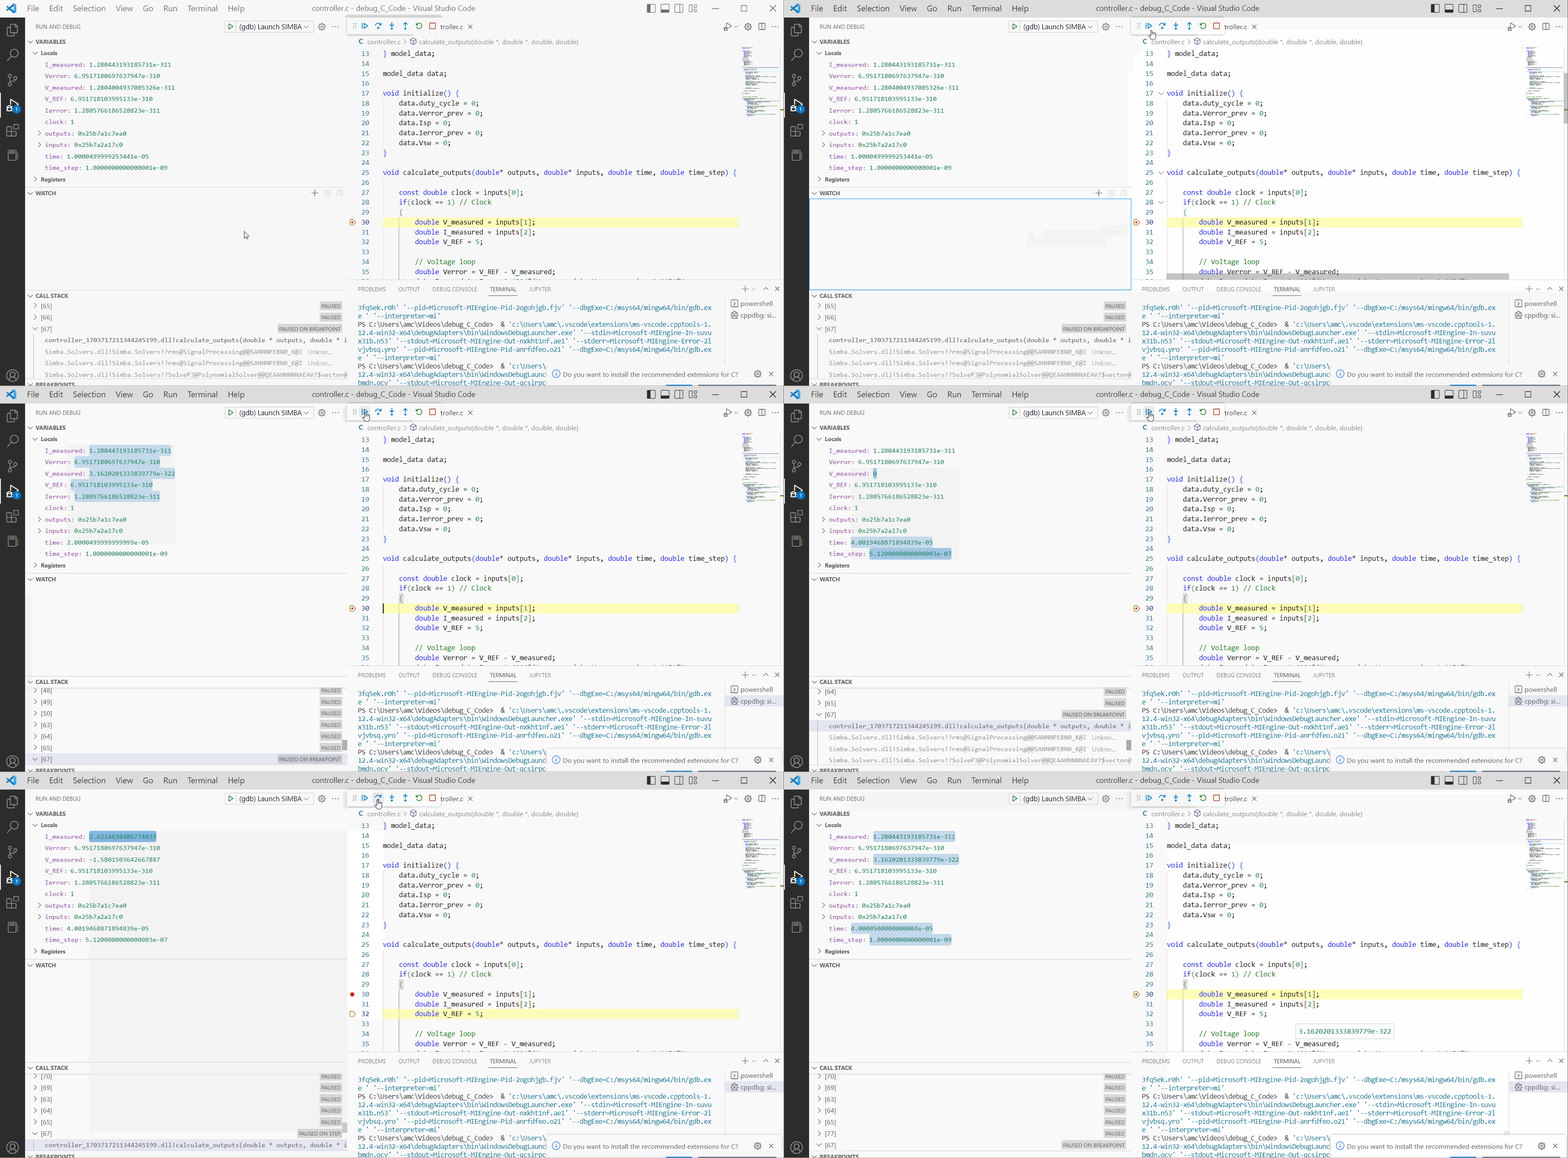
✔ Step 4.g: Let's click into "stop" button and then SIMBA will be closed automatically. The Debug session is now over.
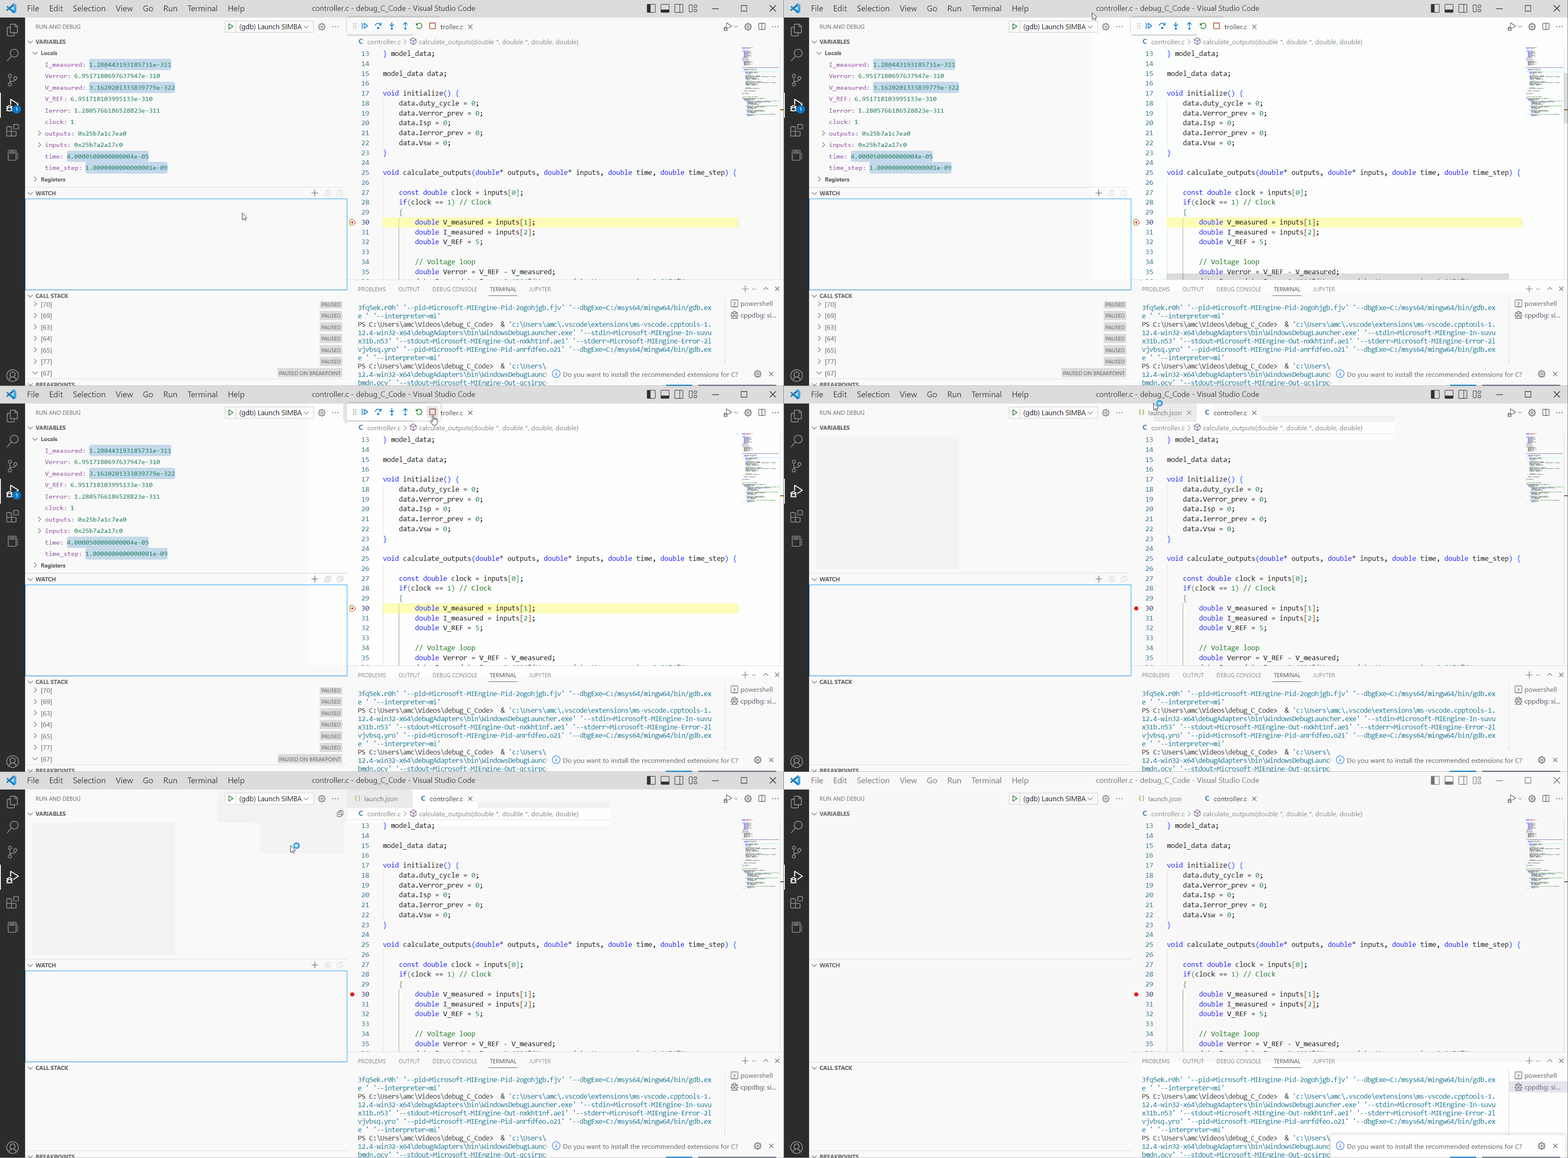
✔ Step 4.h: If you want to restart the "debug session", you'll need to click into "(gdb) Launch SIMBA" button and repeat the process mentionned previously. Also don't forget to delete the 2 .dll files and .o file created before to launch the debug session.

This conclude this tutorial video about how to "Debug the C-code of your C-script block" by using SIMBA, Visual studio and Mingw tools.