Read and use sampled signals (Multi Time-Steps Solver)
This example shows how to read and use sampled signals which have been created with the multi time-step solver.
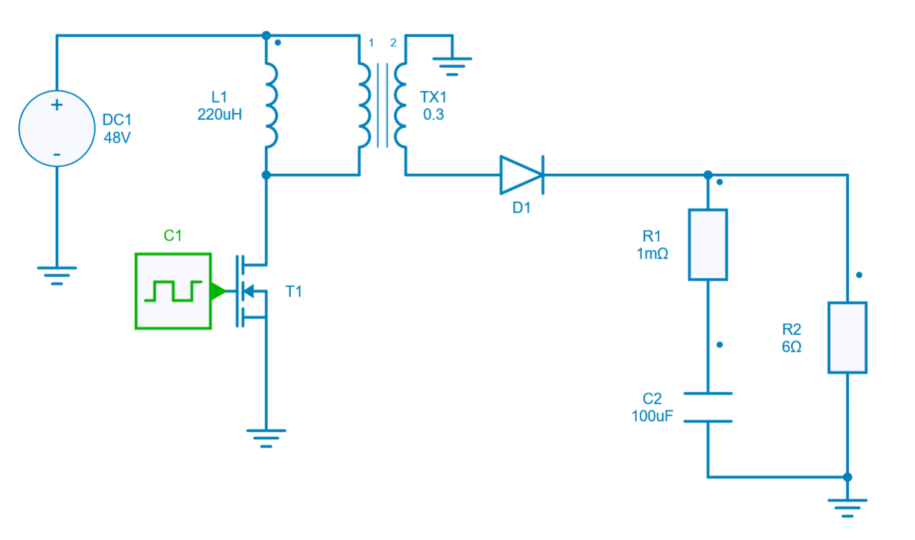
The circuit model used in this example is a flyback converter which is directly loaded from the collection of design examples.
The main steps of this example are the following:
Load Module, Project and Design Example
It requires aesim.simba version 2023.01.19 or higher. Also, matplotlib.pyplot can be imported to view the curves and results.
Add an output voltage probe sampled at 5u
An output voltage probe is added, with a sampling time is set at 5\mu s:
Run Simulation and plot sampled signals
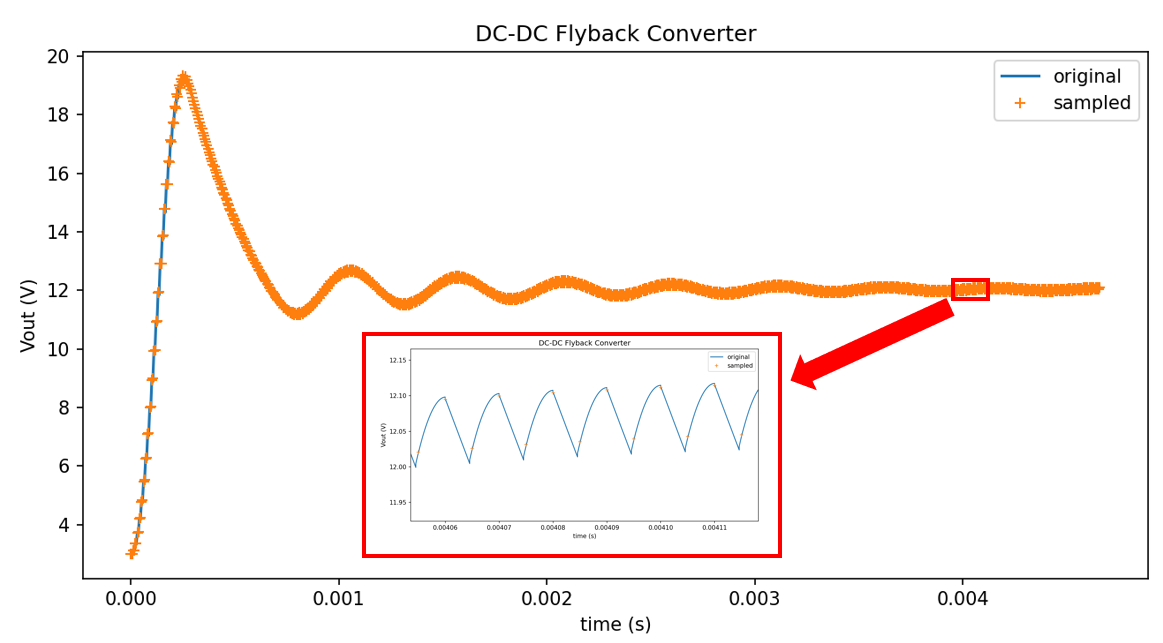
After running the simulation, this last step shows the difference of size between:
- the default output voltage V_{out} measured accross the resistor R2,
- the sampled signal (at 5 \mu s) sampled_signal_data from the voltage probe.
As V_{out} and sampled_signal_data have different sizes, they cannot be plotted with the same time vector and the current vector job.TimePoints cannot be used to plot the sampled signal.
A time data array has to be rebuilt from the sampling time and the sampled_signal_data size with the commande line:
Results are shown below: