SIMBA Benchmark with Analytical Calculations
A benchmark has been realized in order to compare SIMBA simulation results vs analytical calculations from theory for three basic topologies:
- DC-DC Buck converter
- Flyback
- 3-phase Diode Bridge
DC-DC Buck converter
Download Python notebook and its figure
Let's compare the output voltage accross R1 and RMS current through the inductance L1.
SIMBA circuit

Theoritical calculation
Output voltage
< V_{out} > = D \times V_{in}
with:
- V_{in} = 50 V
- duty cycle D= 0.5
Inductance RMS current
(I_L)~rms = \sqrt{\frac{<I_L>^2 + (\Delta_{i_L})^2}{12}}
with:
- R = 5 \Omega
- L = 0.001 H
- f_{sw} = 5000 Hz
< I_L > = \frac{D \times Vin}{R}
\Delta_{i_L} = \frac{D \times (1-D) \times Vin}{L*f_{sw}}
SIMBA simulation
The SIMBA output voltage accross R1 and the RMS current through the inductance L1 have been simulated and below the results:
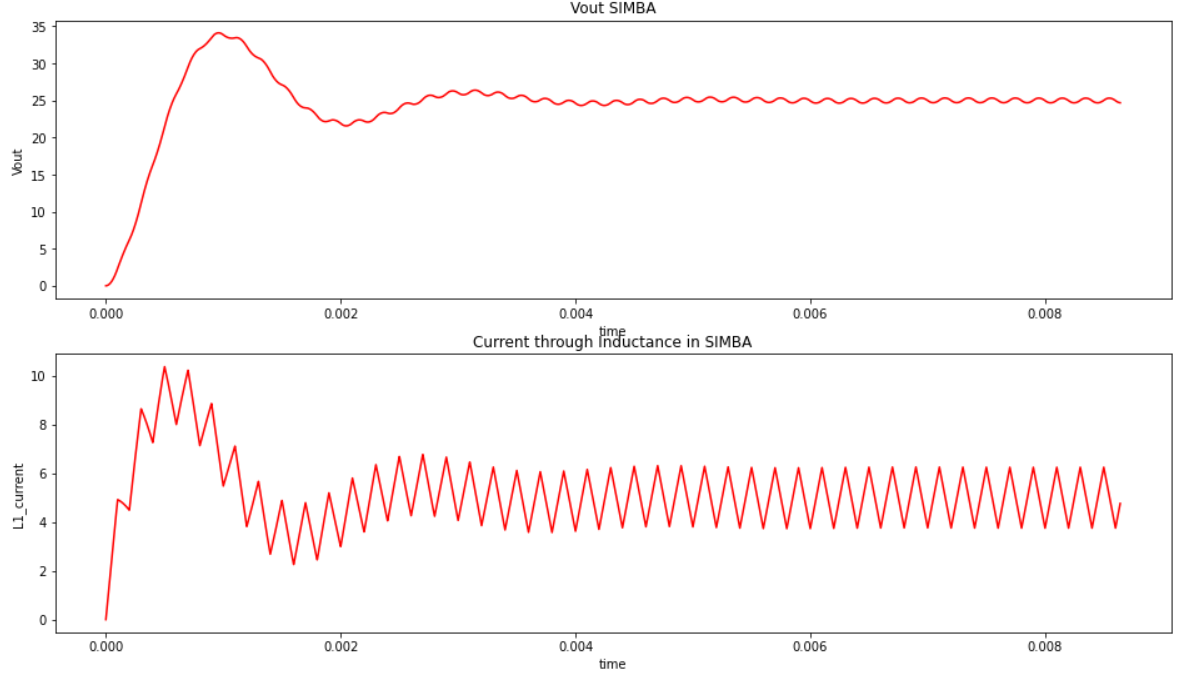
Therefore the comparison between SIMBA and Theory has been done by using histogram to have a clear view of the SIMBA's accuracy:
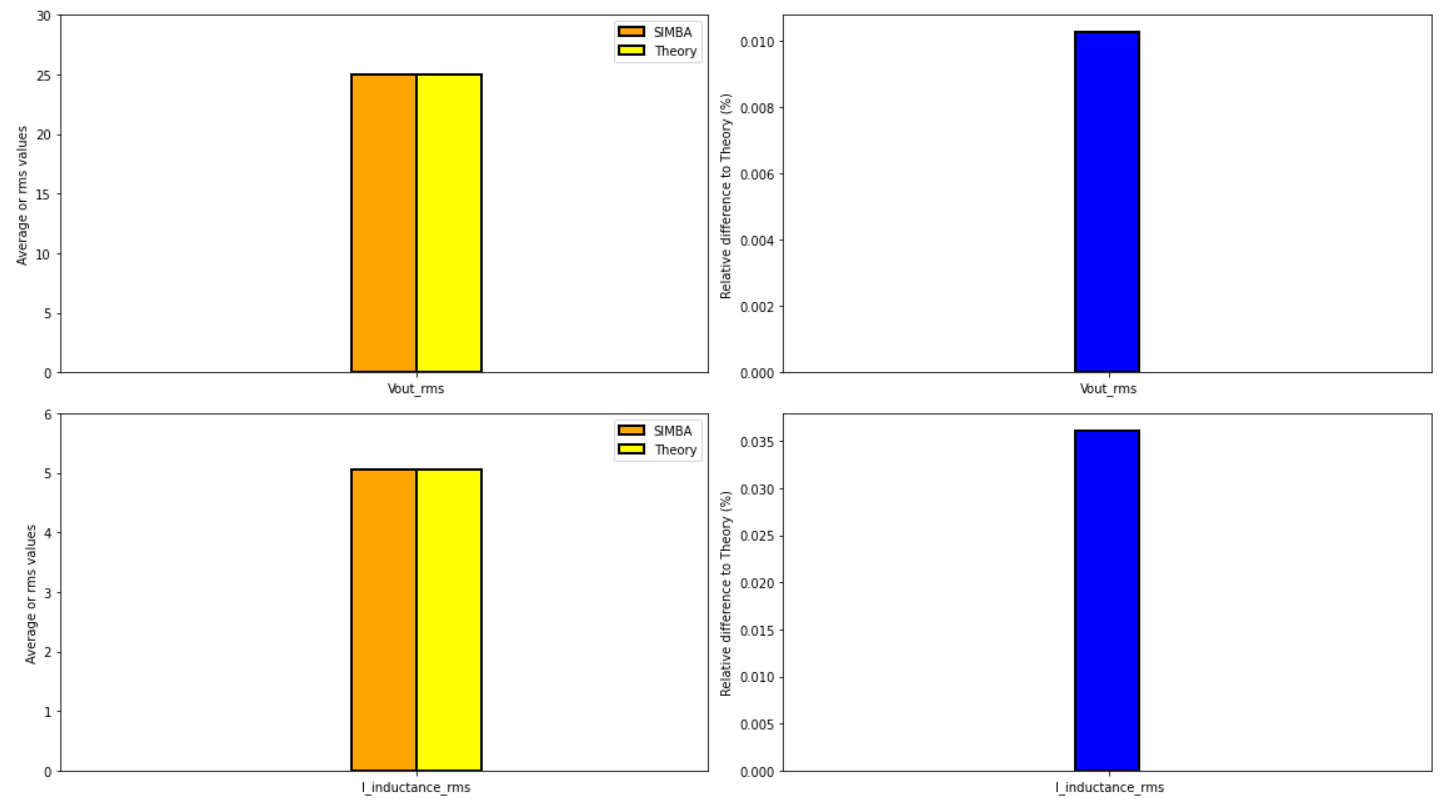
The relative difference is negligeable which shows the reliability and robustness of SIMBA's solver.
Flyback
Download Python notebook and its figure
For this topology, only the average output voltage accross R2 is compared.
SIMBA circuit

Theory calculation
Output voltage
< V_{out} > = V_{in} \times m \times \frac{D}{1-D}
with:
- V_{in} = 6 V
- duty cycle D = 0.25
- N_2 = 2
- N_1 = 1
- m = \frac{N_2}{N_1}
SIMBA simulation
The SIMBA output voltage accross R2 has been simulated and below the results:
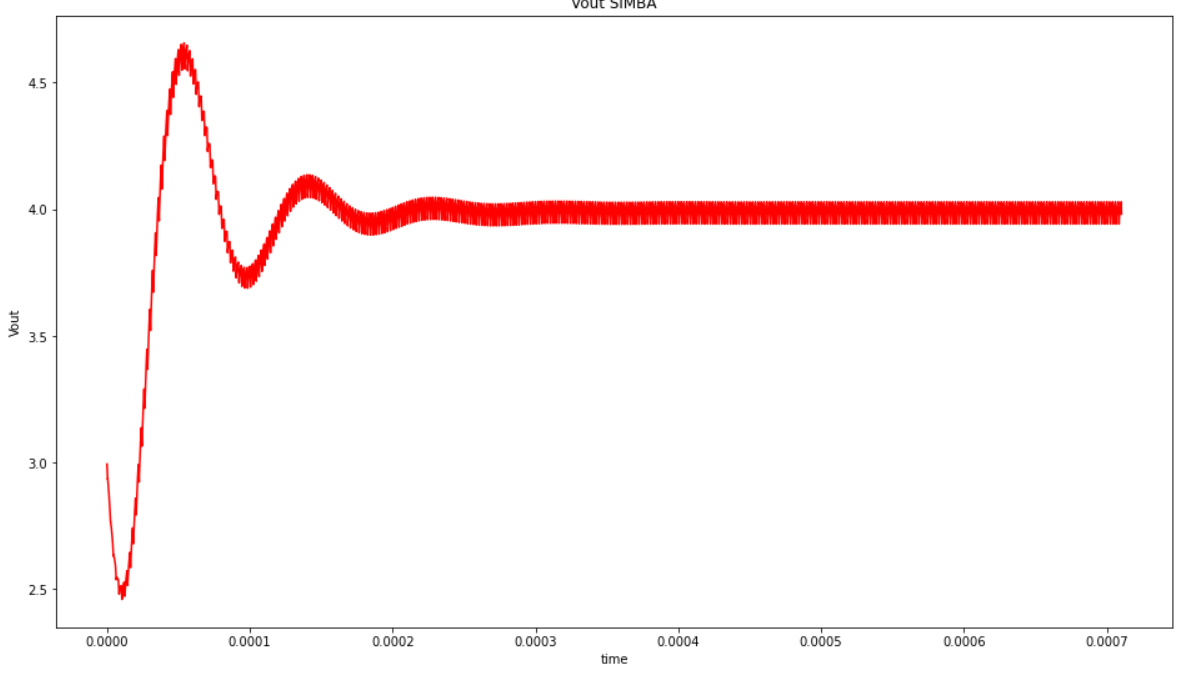
Therefore the comparison between SIMBA and Theory for the average output voltage has been realized and we used the "histogram" way to plot those results.
3 phase Bridge Diode
Download Python notebook and its figure
For this topology we will compare the output average voltage accross DC1 and the input rms current through AC1.
SIMBA circuit

Theory calculation
Average Output voltage
< V_{out} > = \frac{V_{in} \times 3 \times \sqrt{6}}{\pi*\sqrt{2}}
with :
- V_{in} = 380 V
- Input RMS current: $(I_{input}){rms} = I $} \times \sqrt{\frac{2}{3}
- DC current I_{dc} = 10 A
SIMBA simulation
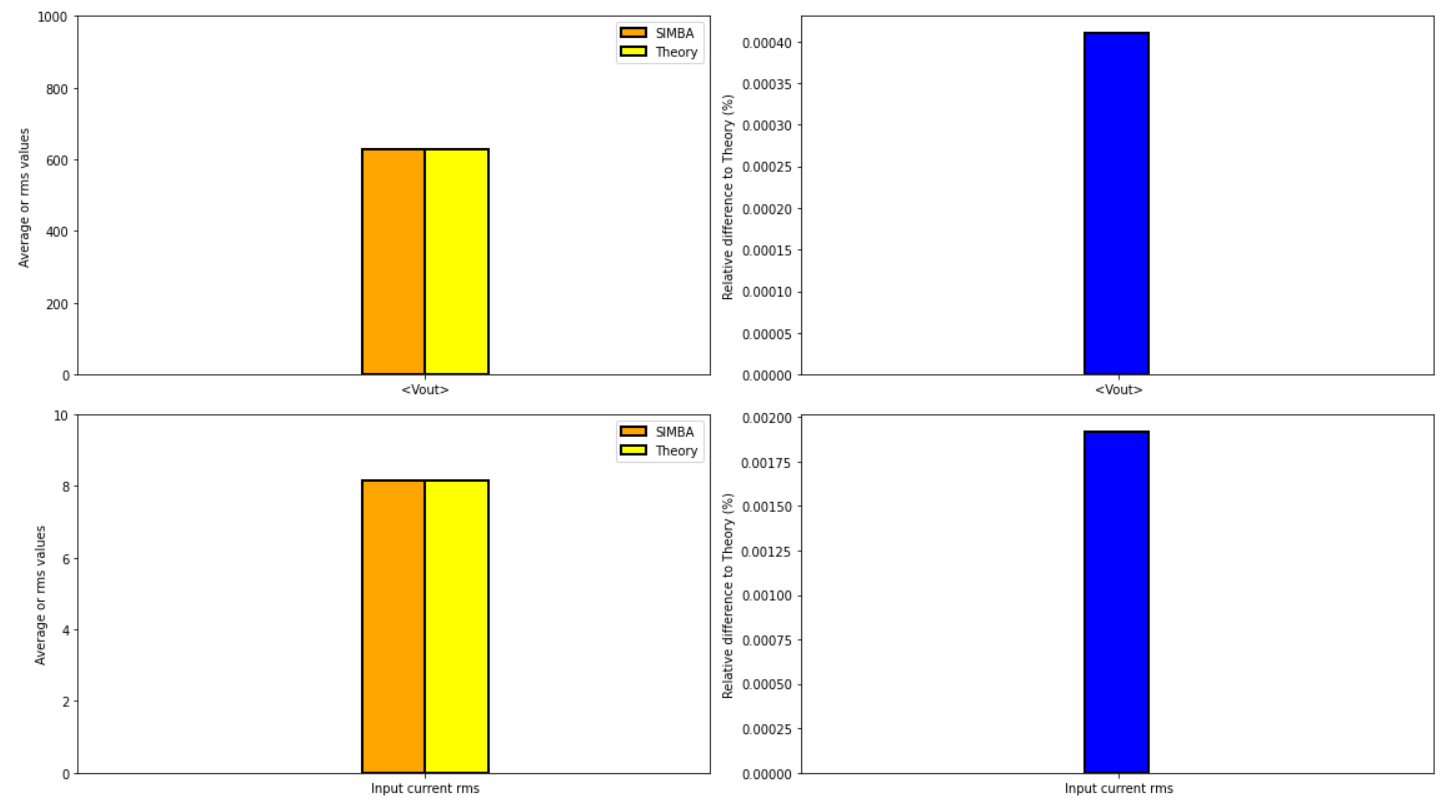
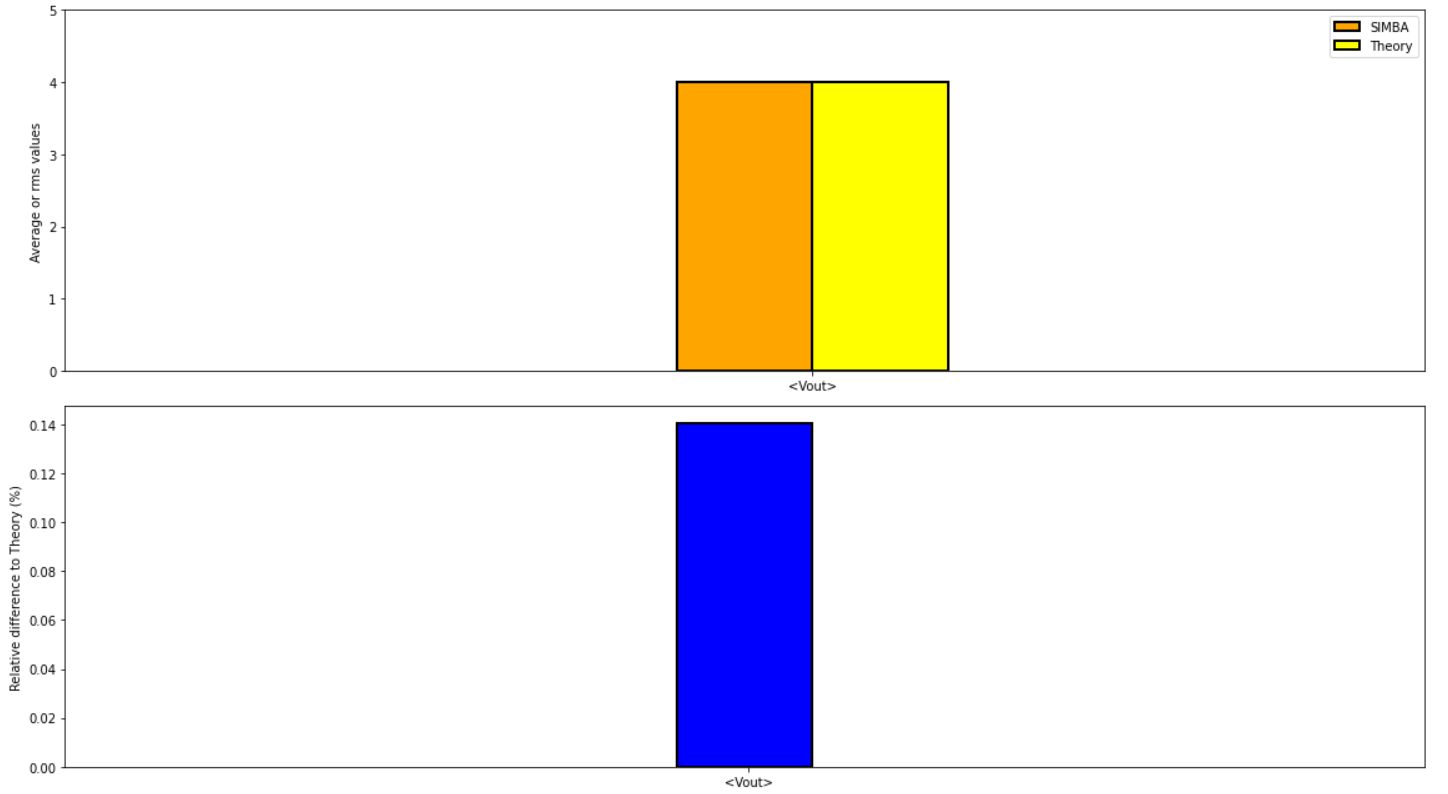
The SIMBA Output Voltage accross DC1 and the input rms current through AC1 have been simulated and below the results:
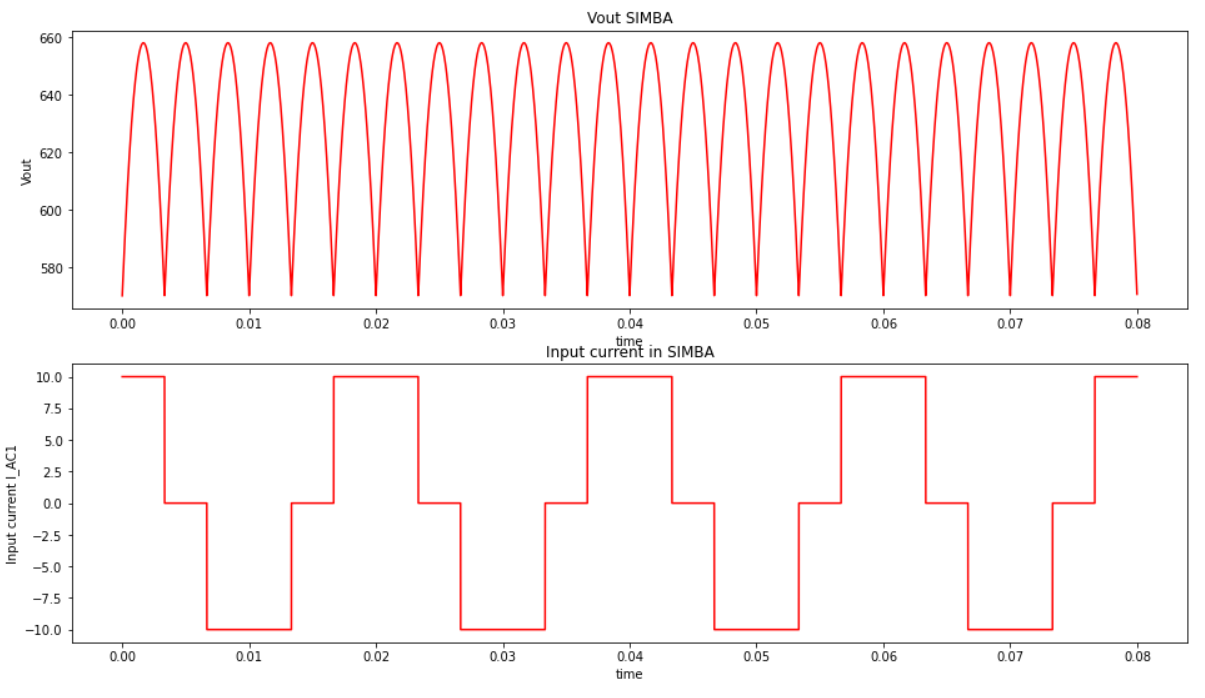
Therefore the comparison between SIMBA and Theory for the average output voltage and the input rms current have been realized. We also plot the results with "histogram" chart.