Debug C Code
It is possible to debug your code using the C Code (External File) model and an external debugger.
C Code (External File)
The differences between the C Code (External File) and the C Code models are:
- The source code must be edited outside SIMBA in an external file. Use the
Source file pathparameter to point to the.cfile. You can download this template to get started. - The code is compiled in Debug mode without optimization (lower performance).
- It is not possible to have multiple instances of the
C Code (External File)model pointing to the same source file.
How to debug your C Code model with SIMBA
Prerequisites
You must do the following steps to get started:
- Install Visual Studio Code.
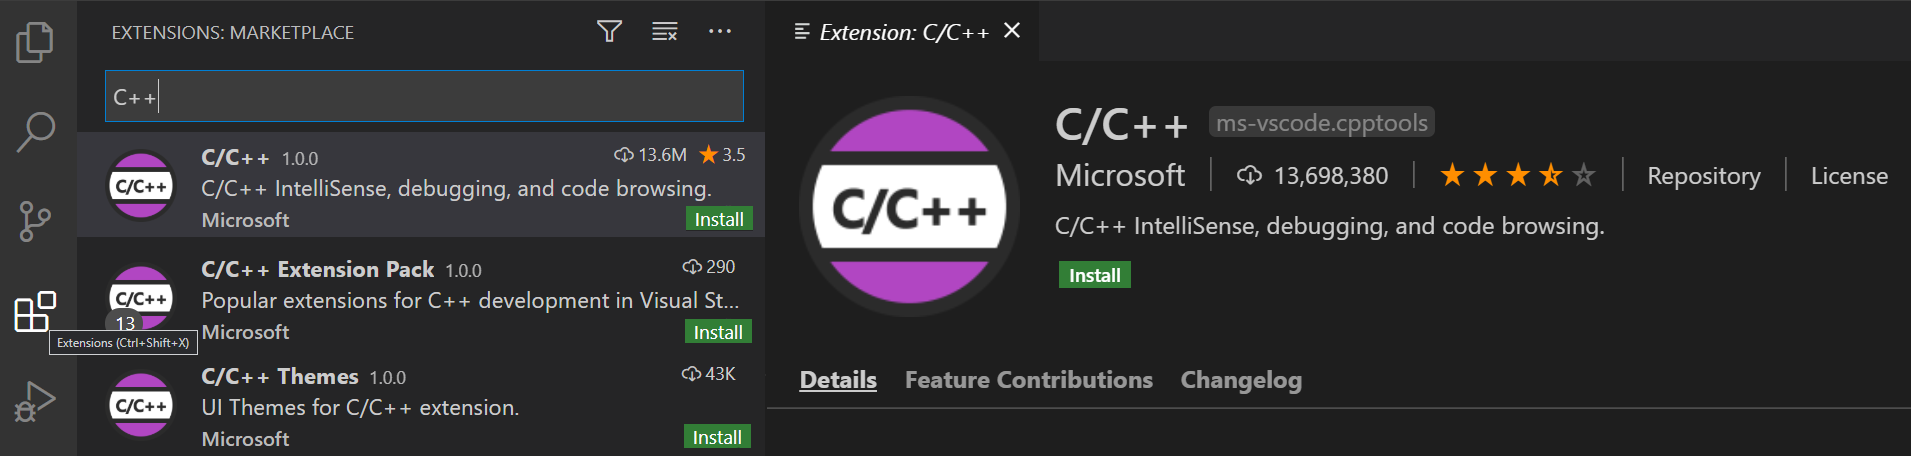
- Install the C/C++ extension for VS Code. You can install the C/C++ extension by searching for 'c++' in the Extensions view.
- Install Mingw-w64 via the SourceForge website. Click Mingw-w64 to download the Windows Mingw-w64 installer.
- Run the installer.
- For Architecture select x86_64 and then select Next.
- On the Installation Folder page, use the default installation folder. Copy the location as you will need it later.
- Select Next to start the installation.
- Create a SIMBA design using a
C Code (External File)model. Open the source file in Visual Studio Code.
Debugger configuration
Next, you'll create a launch.json file to configure VS Code to launch the GDB debugger and SIMBA when you press F5 to debug the program.
From the main menu, choose Run > Add Configuration... and then choose C++ (GDB/LLDB) and Default Configuration.
VS Code creates a default launch.json file that you need to configure by setting the programand miDebuggerPath properties.
1 2 3 4 5 6 7 8 9 10 11 12 13 14 15 16 17 18 19 20 21 22 23 24 25 | |
program must be the path to SIMBA.exe and miDebuggerPath must point to gdb.exe. gdb.exe is located in the bin folder of the Mingw-w64 installation folder. For instance, if Mingw-w64is installed in C:/mingw-w64/, the path should be something similar to C:/mingw-w64/x86_64-8.1.0-win32-seh-rt_v6-rev0/mingw64/bin/gdb.exe.
Important
Paths must use forward slashes.
Start a debugging session
- Go back to your source file so that it is the active file.
- Place breakpoints at the desired location (Where the program will stop).
- Press F5 or from the main menu choose Run > Start Debugging. A new instance of SIMBA will start in DEBUG mode. You will notice that SIMBA is slower.
- In SIMBA, run the simulation. It will first copy the header file (simba_library.h) and compile the source file into a library (.dll) automatically. When SIMBA starts the simulation, Visual Studio should stop at the breakpoints.
Support
If you have any issues or if you are not familiar with C Code, don't hesitate to contact us. We will be pleased to help.
Reference
This guide is adapted from the official Visual Studio tutorial: Using GCC with MinGW.